Parsing Nextcloud Audit Logs with Grafana Loki

Learn how to build a dashboard in Grafana based on audit logs from your Nextcloud server. This tutorial covers the setup and configuration needed to visualize your audit logs in real-time with Grafana.
| What do you need? | Description | Ansible Role for Deployment |
|---|---|---|
| Grafana | Grafana is an open-source interactive data-visualization platform | Ansible Grafana Role in Grafana Collection |
| Grafana Loki | Log aggregation system inspired by Prometheus ( v3+ or newer is required ) | Ansible Loki Role in Grafana Collection |
| Grafana Promtail | Promtail is an agent which ships the contents of local logs to a private Loki | Ansible Promtail Role in Grafana Collection |
| Nextcloud | The most popular on-premises content collaboration platform | Not Available |
| Tested on | Description |
|---|---|
| RedHat Enterprise Linux (RHEL) 8 and 9 | It should work on other Linux systems as well |
Grafana 11.1.4+ | Tested with Grafana version |
Nextcloud 29+ | Tested with Nextcloud Version (bare metal installation with MariaDB and Redis / Podman with PostgreSQL and Redis) |
This guide provides source code for a dashboard that you can import and use. There are explained queries for three panels to help you better understand how it works. This should help you create your own queries or modify the dashboard if needed. I assume that you have already deployed Nextcloud, Grafana, Grafana Loki, and Promtail. I will not instruct you on how to deploy these tools as there is nice official documentation for each one. I will only explain the configuration needed for this dashboard and why it is required.
Dashboard Preview
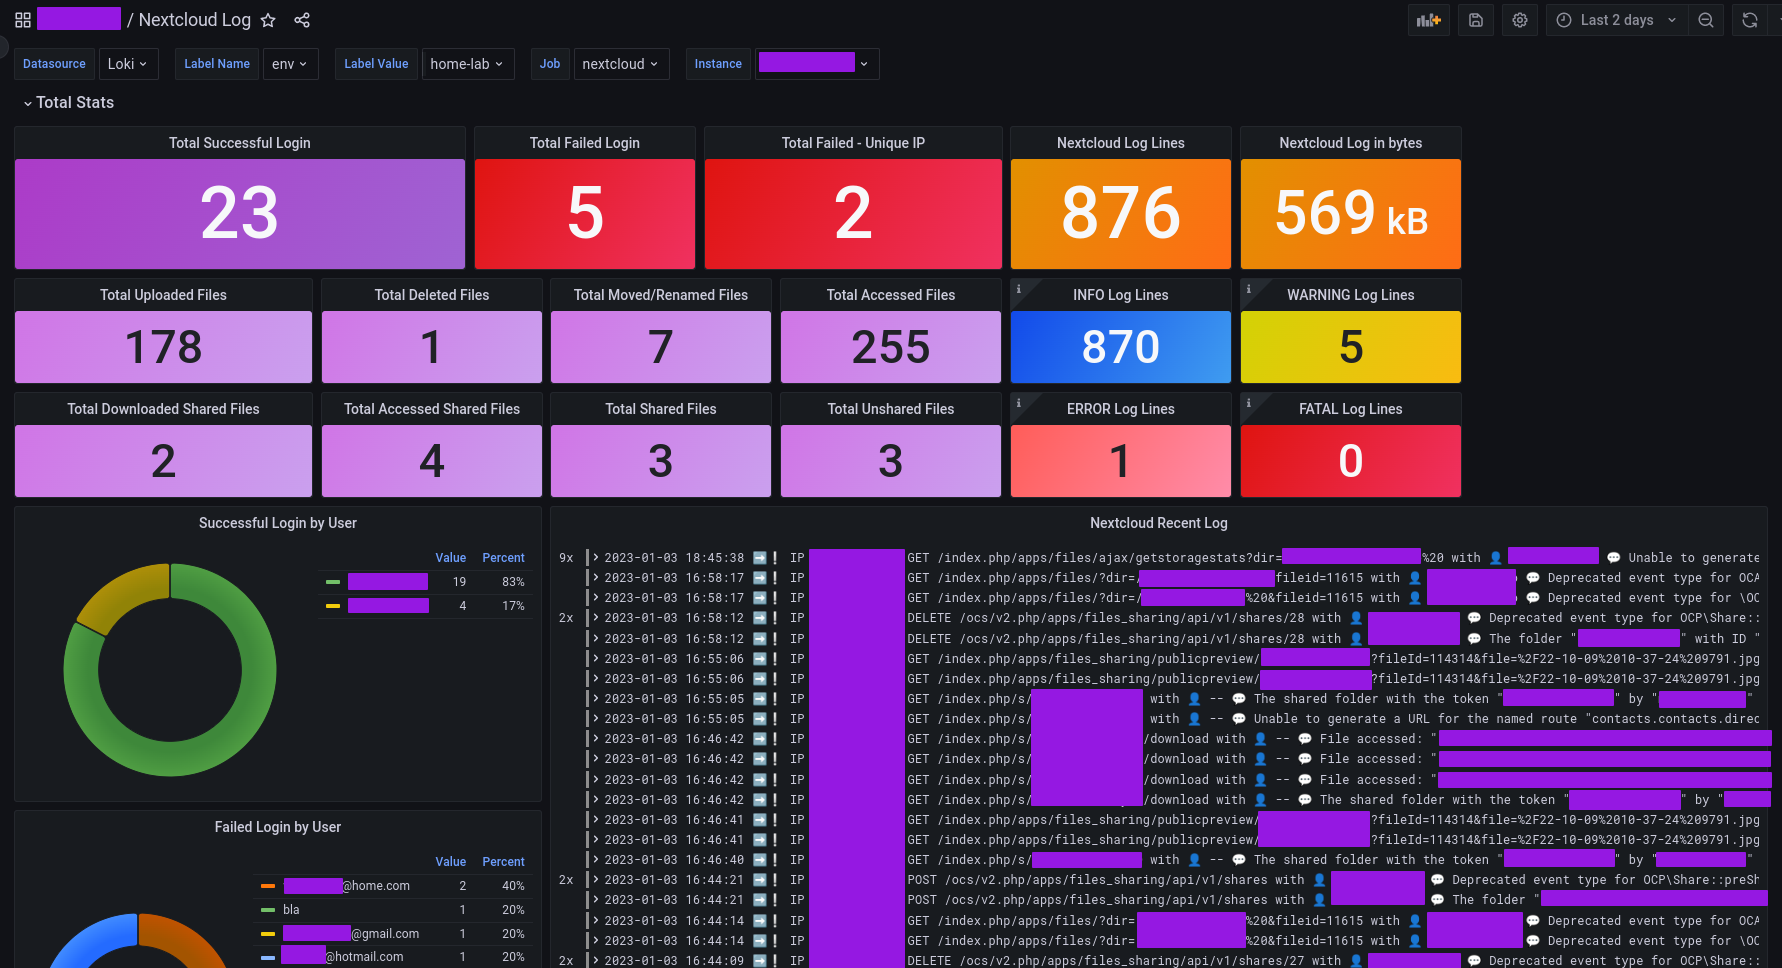
Dashboard Features
All dashboard panels calculate data based on the selected interval (e.g., 2 days).
| Panel title | Panel type | Description |
|---|---|---|
| Total Successful Login | Stat | sum of all Nextcloud successful login |
| Total Failed Login | Stat | sum of all Nextcloud failed login |
| Total Failed - Unique IP | Stat | sum of all unique IPs for a failed Nextcloud Login |
| Nextcloud Log Lines | Stat | calculate the number of lines for Nextcloud log entries from audit.log and nextcloud.log |
| Nextcloud Log in bytes | Stat | calculate log size for Nextcloud entries ( audit.log and nextcloud.log) |
| Total Uploaded Files | Stat | sum of all uploaded files |
| Total Deleted Files | Stat | sum of all deleted files |
| Total Moved/Renamed Files | Stat | sum of all Moved/Renamed files |
| Total Accessed Files | Stat | sum of all accessed files ( file preview included ) |
| Total Downloaded Shared Files | Stat | sum of all Downloaded shared files |
| Total Accessed Shared Files | Stat | sum of all accessed shared files |
| Total Shared Files | Stat | sum of all shared files |
| Total Unshared Files | Stat | sum of all unshared files |
| INFO Log Lines | Stat | calculate the number of INFO lines (level 1) for Nextcloud log entries from audit.log and nextcloud.log |
| WARNING Log Lines | Stat | calculate the number of WARNING lines (level 2) for Nextcloud log entries from audit.log and nextcloud.log |
| ERROR Log Lines | Stat | calculate the number of ERROR lines (level 3) for Nextcloud log entries from audit.log and nextcloud.log |
| FATAL Log Lines | Stat | calculate the number of FATAL lines (level 4) for Nextcloud log entries from audit.log and nextcloud.log |
| Successful Login by User | Pie Chart | List of users who successfully login |
| Failed Login by User | Pie Chart | List of users who fail to login |
| Nextcloud Recent Log | Logs | All (INFO, WARNING, ERROR, FATAL) log entries for selected dashboard interval |
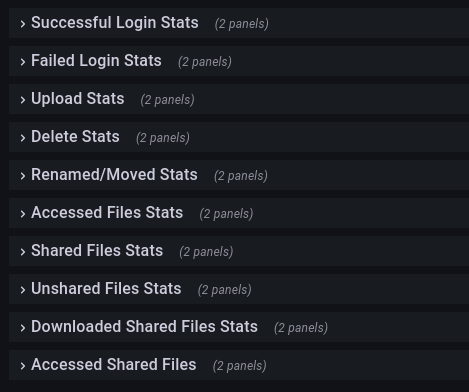
The following panels are basically the same for ( Successful Login, Failed Login, Upload, Delete, Renamed/Moved, Accessed, Shared, Unshared, Downloaded Shared Files, and Accessed Shared Files )
| Panel title | Panel type | Description |
|---|---|---|
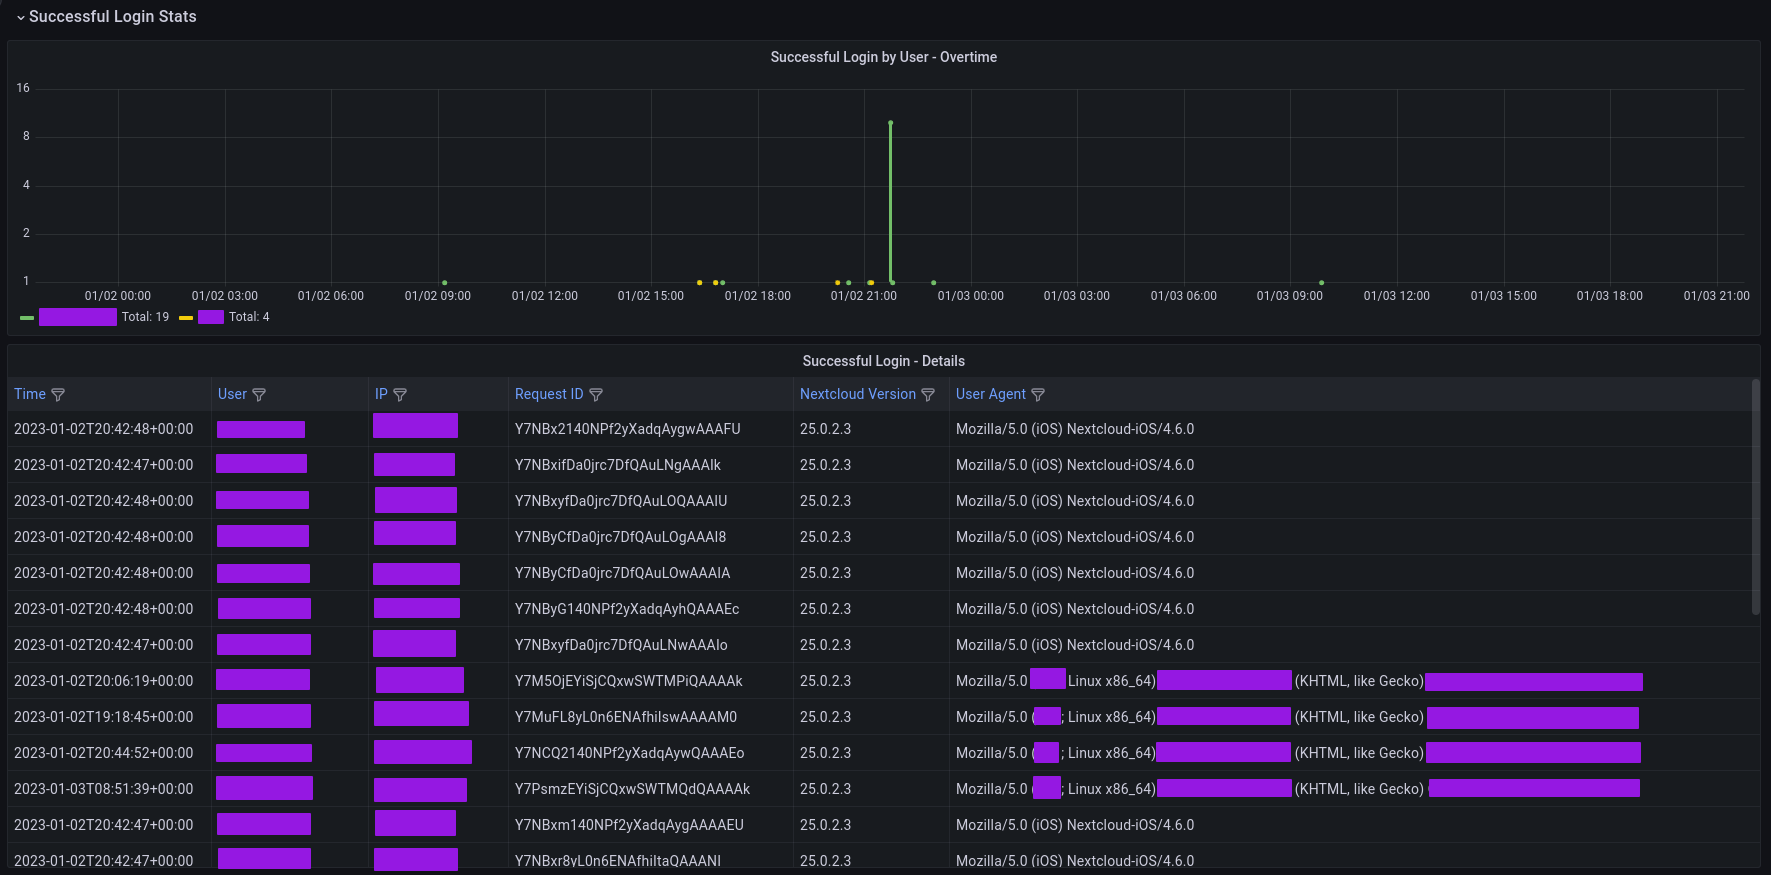
| Successful Login by User - Overtime | Time Series | Show the users who successfully login over time on the time series graph |
| Successful Login - Details | Table | Table format which provides detailed information about successful login requests (e.g. Time, User, IP, Request ID, NC Version, User Agent) |
Nextcloud Logging Configuration
Nextcloud logging provides standard application logs and also has the possibility to enable audit logging. For this dashboard, audit logging is necessary! The configuration below is what I use on my Nextcloud instance:
-
Create the
/var/log/nextclouddirectory and ensure that your web server has the correct permissions (both owner and group). This directory will be used for storingnextcloud.logandaudit.logfiles. -
If you are using SELinux in enforcing mode (which is recommended), it's important to add the following contexts:
semanage fcontext -a -t httpd_log_t '/var/log/nextcloud'
semanage fcontext -a -t httpd_log_t '/var/log/nextcloud/(/.*)?'
-
Make sure that the "Auditing/Logging" application is installed and enabled in Nextcloud. You can locate it in the apps section using your admin account.
-
Ensure the following configuration settings are present in Nextcloud's
config/config.phpfile:
  'loglevel' => 1,
  'log_type' => 'file',
  'logfile' => '/var/log/nextcloud/nextcloud.log',
  'log_type_audit' => 'file',
  'logfile_audit' => '/var/log/nextcloud/audit.log',
These settings define the logging behavior for Nextcloud and ensure that logs are written to the specified files in /var/log/nextcloud/.
- Config field explained:
| Config Field | Config Value | Description |
|---|---|---|
loglevel | 1 | Enable INFO Logging. (FYI: 1-Info, 2-Warning, 3-Error, 4-Fatal) |
log_type | file | Nextcloud standard application log in file format |
logfile | /var/log/nextcloud/nextcloud.log | Destination for application log ( ensure that /var/log/nextcloud path exists and has the correct permission ) |
log_type_audit | file | Nextcloud audit log in file format |
logfile_audit | /var/log/nextcloud/audit.log | Destination for audit log ( ensure that /var/log/nextcloud path exists and has the correct permission |
I recommend checking the official documentation for a detailed explanation of Nextcloud logging.
Ensure that "INFO" logging is enabled! Otherwise, the dashboard will not work properly. It requires this information.
Thanks to JSON logs
I must really appreciate the decision by Nextcloud developers to use the JSON format for application and audit logs. The reason I love it is simple. Loki provides a "JSON" parser that extracts fields for us, making dashboard creation simpler and quicker. However, there are still some fields that we must parse because we need to extract specific values ( explained in Failed Login by User - Pie Chart section ).
Promtail configuration
server:
  http_listen_port: 9080  #Promtail listen port
  grpc_listen_port: 0

positions:
  filename: /tmp/positions.yaml

clients:
  - url: http://loki.voidquark.com:3100/loki/api/v1/push  #Loki target instance

scrape_configs: #The most important part
- job_name: system
  static_configs:
  - targets:
      - localhost #Promtail target is localhost
    labels:
      instance: nextcloud.voidquark.com #Label identifier for instance (hostname -f)
      env: home-lab #Environment label
      job: nextcloud #Job label
      __path__: /var/log/nextcloud/{nextcloud,audit}.log
The dashboard requires the following labels: job and instance. The label with the name env is optional. Ensure that your Promtail has the required labels, otherwise the dashboard query will not work correctly.
Dashboard labels
The first step is to import the dashboard. There are multiple ways to import a dashboard. For example, you can import the dashboard manually from the Grafana instance by pasting the dashboard JSON. My preferred way is to provision the dashboard programmatically via Ansible. This blog will not describe how to accomplish this. I recommend checking the Grafana documentation and using the method that you prefer.
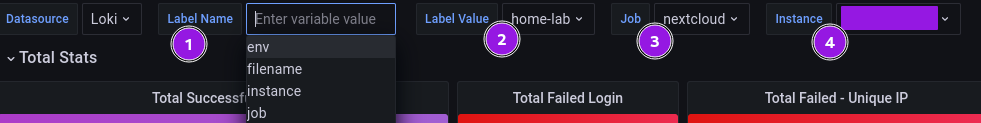
Once the dashboard is imported, it is important to explain how the top bar works. You can select the "Label Name" (1) that you configured in Promtail. In the screenshot above, I selected env. For this label name, I selected the label value home-lab (2). The job is nextcloud (3), which contains both logs nextcloud.log and audit.log. This means the dashboard will read data from both logs that are stored in Loki with this label. The last important step is to select your instance (4) in case you have multiple Nextcloud instances. These variables are used in each panel to query data.
Total Successful Login - Stat Panel

Let me start with the simplest panel, which basically counts the number of lines in the log with the exact message. This is converted into a metric number, and then the Grafana Stat panel simply displays the number of strings present in the log.
- Log Example ( check official Nextcloud logging documentation for each field explanation )
{
  "reqId": "Y7iGhydDa0jrc7DfQAudBwAAAII",
  "level": 1,
  "time": "2023-01-06T20:24:39+00:00",
  "remoteAddr": "10.0.20.20",
  "user": "Bob.Marley",
  "app": "admin_audit",
  "method": "PUT",
  "url": "/ocs/v2.php/apps/user_status/api/v1/heartbeat?format=json",
  "message": "Login successful: \"Bob.Marley\"",
  "userAgent": "Mozilla/5.0 (X11; Linux x86_64) AppleWebKit/537.36 (KHTML, like Gecko) Chrome/89.0.4389.114 Safari/537.36",
  "version": "29.0.4.1",
  "data": {
    "app": "admin_audit"
  }
}
- Panel Query
sum by(instance) (count_over_time({$label_name=~"$label_value", job=~"$job", instance=~"$instance"}
| json
| message=~"Login successful.*"
| __error__="" [$__interval]))
In the query, you can see how variables are used, as explained in the Dashboard labels section. The log has a nice structure, and Grafana Loki does all the work for us. So first, use | json to parse the JSON log and automatically extract the field. Then search for | message=~"Login successful.*", and at the end add | __error__="" because we use count_over_time to convert the number of occurrences to a metric value. It is important to use the error filter because metrics cannot contain errors! The last important step is to sum by(instance) because we want to know how many successful logins were detected on this instance only.
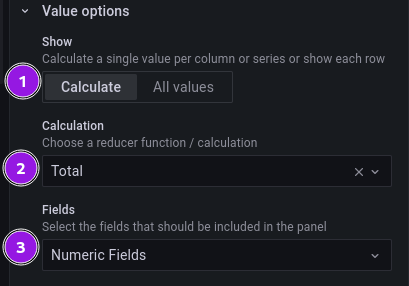
The last thing to do is configure the calculation function in the Grafana panel, which displays the total number of successful logins.
We are done with this panel. You can see that it was quite simple.
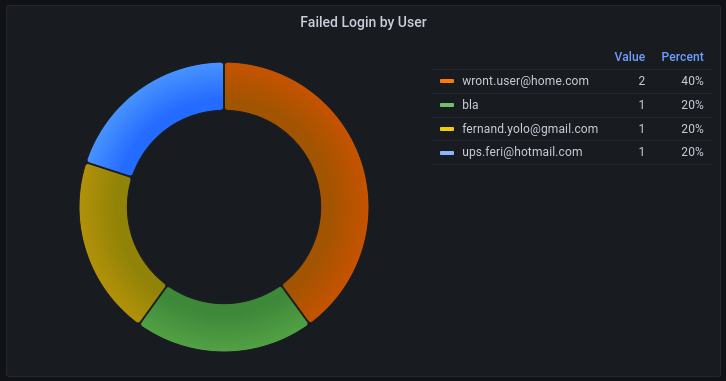
Failed Login by User - Pie Chart
Not all information is located in the audit log. For example, failed login attempts are located in the nextcloud.log. That is the reason why this dashboard requires some information from the audit.log and from the nextcloud.log.
- Log Example for failed login
{
"reqId": "Y7NM@G240NPf2yRagqAzGgAAAFQ",
"level": 2,
"time": "2023-01-02T21:30:32+00:00",
"remoteAddr": "10.0.10.20",
"user": "--",
"app": "no app in context",
"method": "POST",
"url": "/index.php/login",
"userAgent": "Mozilla/5.0 (X11; Linux x86_64) AppleWebKit/537.36 (KHTML, like Gecko) Chrome/89.0.4389.114 Safari/537.36",
"version": "29.0.4.1",
"data": []
}
- Panel Query
sum by (username) (count_over_time({$label_name=~"$label_value", job=~"$job", instance=~"$instance"}
| json
| message=~"Login failed.*"
| pattern `<_>Login failed: <username> (Remote IP: <_>`
| __error__="" [$__interval]))
First, we use the | json filter to extract the JSON fields automatically. The next filter looks for the | message=~"Login failed.*" failed login message. You can see that the username is inside the message. In this case, it is a good idea to use the pattern filter, which helps us extract a specific part. In this case, I constructed a simple pattern <_>Login failed: <username> (Remote IP: <_>. This extracts the username and stores it in the username variable. The next step is to use | __error__="" to filter out potential errors. This step is recommended because the result is converted to a metric value by count_over_time for the selected [$__interval]. This provides the number of occurrences for the selected interval. At the end, it is important to sum by each username, so it is known which user failed how many times. The last thing to do is use the Grafana panel's calculation option to display the "Total" failed logins.

Nextcloud Recent Log - Log Panel
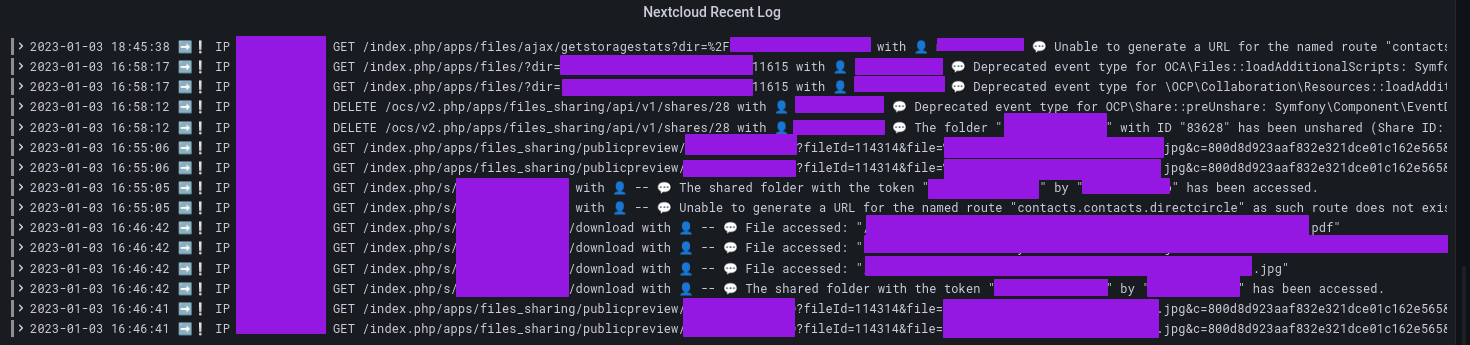
We have a JSON log, so it is quite simple to parse it and display the data that we want. But what if we want to display these lines like a standard log? The way to solve this is to use the extracted fields to construct a log line. The best part is that we can remove unimportant parts and keep only what we want, reducing the log line length. Additionally, I decided to use emojis to quickly spot which log line represents an (INFO, WARNING, ERROR, FATAL) log message. So let me explain each piece.
-
The panel contains 4 different queries due to (INFO, WARNING, ERROR, FATAL) messages. This means the panel queries 4 different queries and at the end, everything is merged together.
-
LogQL A
{$label_name=~"$label_value", job=~"$job", instance=~"$instance"}
| json
| level="1"
| line_format "➡️❕ IP {{.remoteAddr}} {{.method}} {{.url }} with 👤 {{.user}} 💬 {{.message }}"
- LogQL B
{$label_name=~"$label_value", job=~"$job", instance=~"$instance"}
| json
| level="2"
| line_format "➡️⚠️ IP {{.remoteAddr}} {{.method}} {{.url }} with 👤 {{.user}} 💬 {{.message }}"
- LogQL C
{$label_name=~"$label_value", job=~"$job", instance=~"$instance"}
| json
| level="3"
| line_format "➡️🚨 IP {{.remoteAddr}} {{.method}} {{.url }} with 👤 {{.user}} 💬 {{.message }}"
- LogQL D
{$label_name=~"$label_value", job=~"$job", instance=~"$instance"}
| json
| level="4"
| line_format "➡️☠️ IP {{.remoteAddr}} {{.method}} {{.url }} with 👤 {{.user}} 💬 {{.message }}"
It is visible that the lines are the same, only the EMOJI and level filter are different. So let me recap what happens in each query (A, B, C, D). Each query uses | json to extract fields from the JSON log. The next filter is | level="1" for INFO messages (the number changes for each query). Grafana Loki supports line_format, which helps us build a custom log line. In this example, only a few extracted fields are used. You can always modify this to meet your needs. Then we use different emojis to quickly spot which line is INFO and which one is ERROR, for example. This way is much easier to read each line.
- EMOJI Explained
| EMOJI | Description |
|---|---|
| ➡️ | Start of the customized log line |
| ❕ | INFO (level 1) log lines |
| ⚠️ | WARNING (level 2) log lines |
| 🚨 | ERROR (level 3) log lines |
| ☠️ | FATAL (level 4) log lines |
| 👤 | After this emoji you will spot username for acting user(who did this request) |
| 💬 | Log message |
Regarding line_format, I recommend checking the Grafana Loki LogQL language documentation.
Source code available for everyone
I decided to publish this blog post because I did not find a dashboard for the Nextcloud audit log. I know that the dashboard will not fit everyone's needs, so feel free to modify it. I hope it helps anyone who was looking for something like this. If you want future dashboard revisions, stay up to date and subscribe to my social links 🚀.
If you are interested in how you can create alerts for Alertmanager based on logs, check out this example.
For example, you can create alerting rules that trigger an alert if the following occurs:
- More than 10 authentication failures from unique IPs.
- A user shares too many files in a short period (e.g. more than 100 files in the last 10 minutes).
- A user shared too many files that were downloaded in the last 30 minutes.
- A fatal error was detected on the Nextcloud instance in the last 30 minutes.
- The error rate is high on the Nextcloud instance.
- The warning rate is high on the Nextcloud instance.
This can help you catch strange user behavior or anomalies. These are just a few examples; you can do much more. Be creative and practical.
Thanks for reading. I'm entering the void. 🛸 ➡️ 🕳️