Parsing SSH Logs with Grafana Loki


Do you want to see who is accessing your server through SSH or trying some malicious attempt on SSH? Then you visited the right blog post.
| What do you need? | Description | Ansible Role for Deployment |
|---|---|---|
| Grafana | Grafana is an open-source interactive data-visualization platform | Ansible Grafana Role in Grafana Collection |
| Grafana Loki | Log aggregation system inspired by Prometheus | Ansible Loki Role in Grafana Collection |
| Grafana Promtail | Promtail is an agent which ships the contents of local logs to a private Loki | Ansible Promtail Role in Grafana Collection |
| Alertmanager (optional) | The Alertmanager handles alerts sent by client applications such as the Prometheus server or Loki server. | Alertmanager |
| Tested on | Description |
|---|---|
| RedHat Enterprise Linux (RHEL) 8 and 9 | It should work on other RedHat Family systems as well |
| Grafana 9.2.7+ | Tested with Grafana version |
SyslogFacility AUTHPRIV | sshd_config parameter |
LogLevel INFO | sshd_config parameter |
/var/log/secure | Consumed log |
The post is not about Grafana, Loki, Promtail deployment, or how to harden the SSH server and your server in general. The focus is to create a LogQL query for the most important information generated by sshd.
Quick explanation for some LogQL queries used in SSH Log Dashboard. SSH alerting rule example for Alertmanager.
Dashboard preview
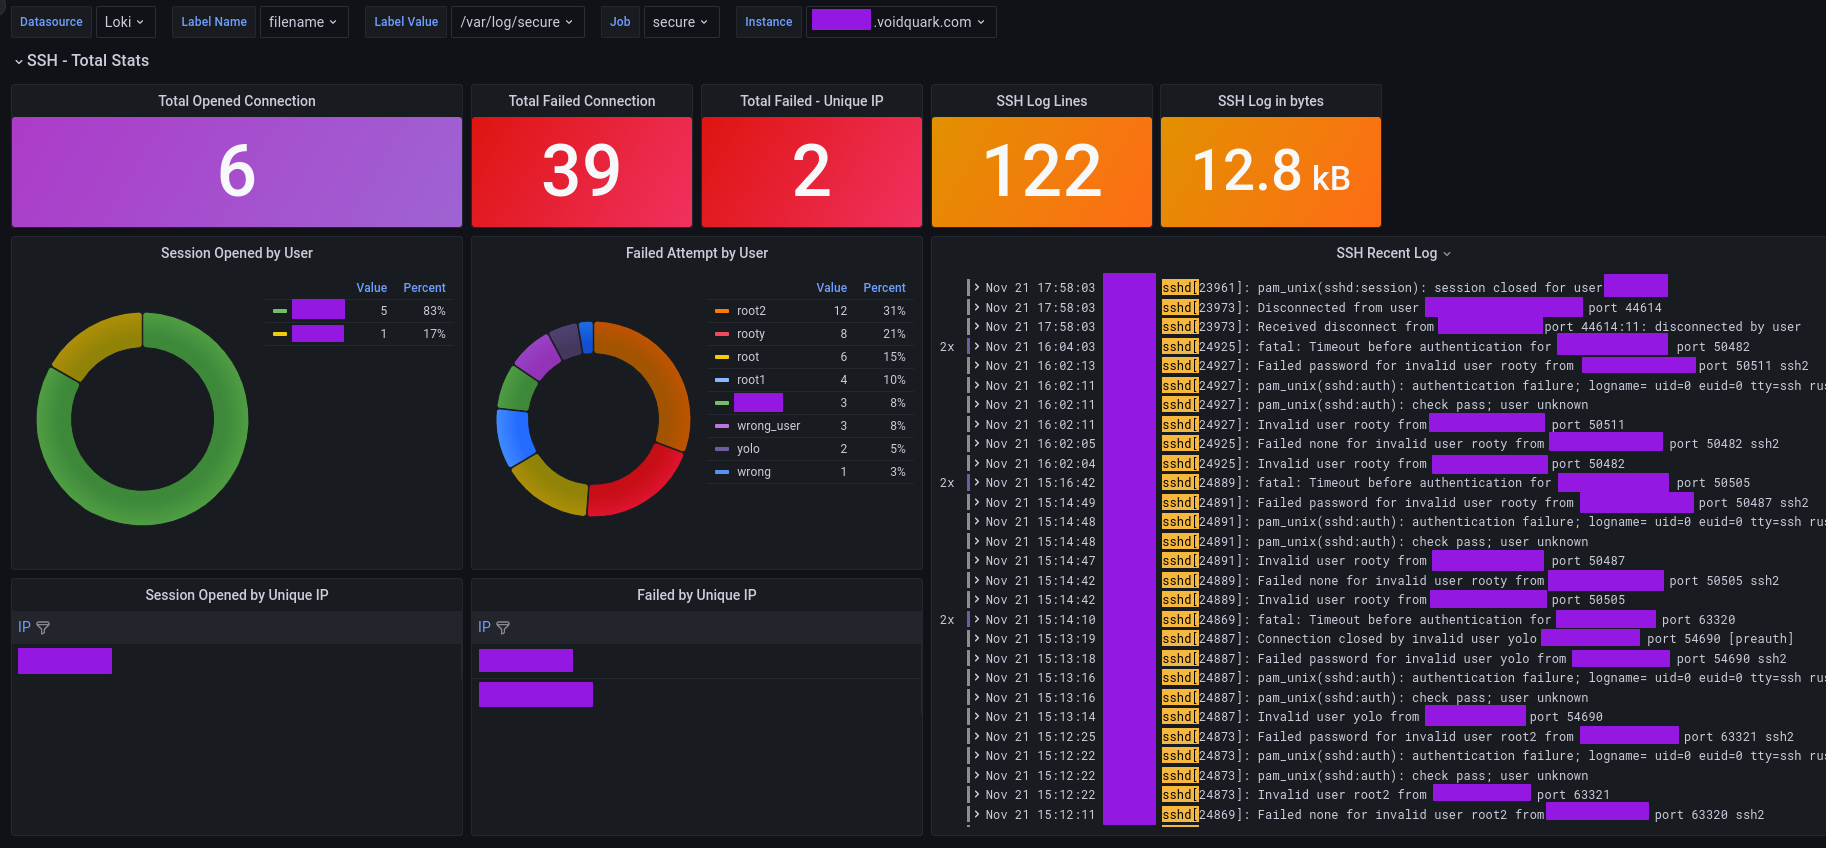
Dashboard Features
Dashboard panels filter data based on dashboard interval ( e.g you select 24h ).
| Panel title | Panel type | Description |
|---|---|---|
| Total Opened Connection | Stat | sum of all opened sessions through SSH |
| Total Failed Connection | Stat | sum of all Failed SSH attempts |
| Total Failed Unique IP | Stat | sum of all unique IPs for a failed SSH attempt |
| SSH Log Lines | Stat | calculate the number of lines for SSH entries |
| SSH Log bytes | Stat | calculate log size for SSH entries |
| Session opened by user | Pie Chart | user list which opened the SSH session |
| Failed attempt by user | Pie Chart | user list with failed SSH attempt |
| Session opened by unique IP | Table | List of unique IPs which successfully opened SSH session |
| Failed by unique IP | Table | List of unique IPs which made failed SSH attempt |
| SSH Recent log | Logs | All SSH log entries for selected dashboard interval |
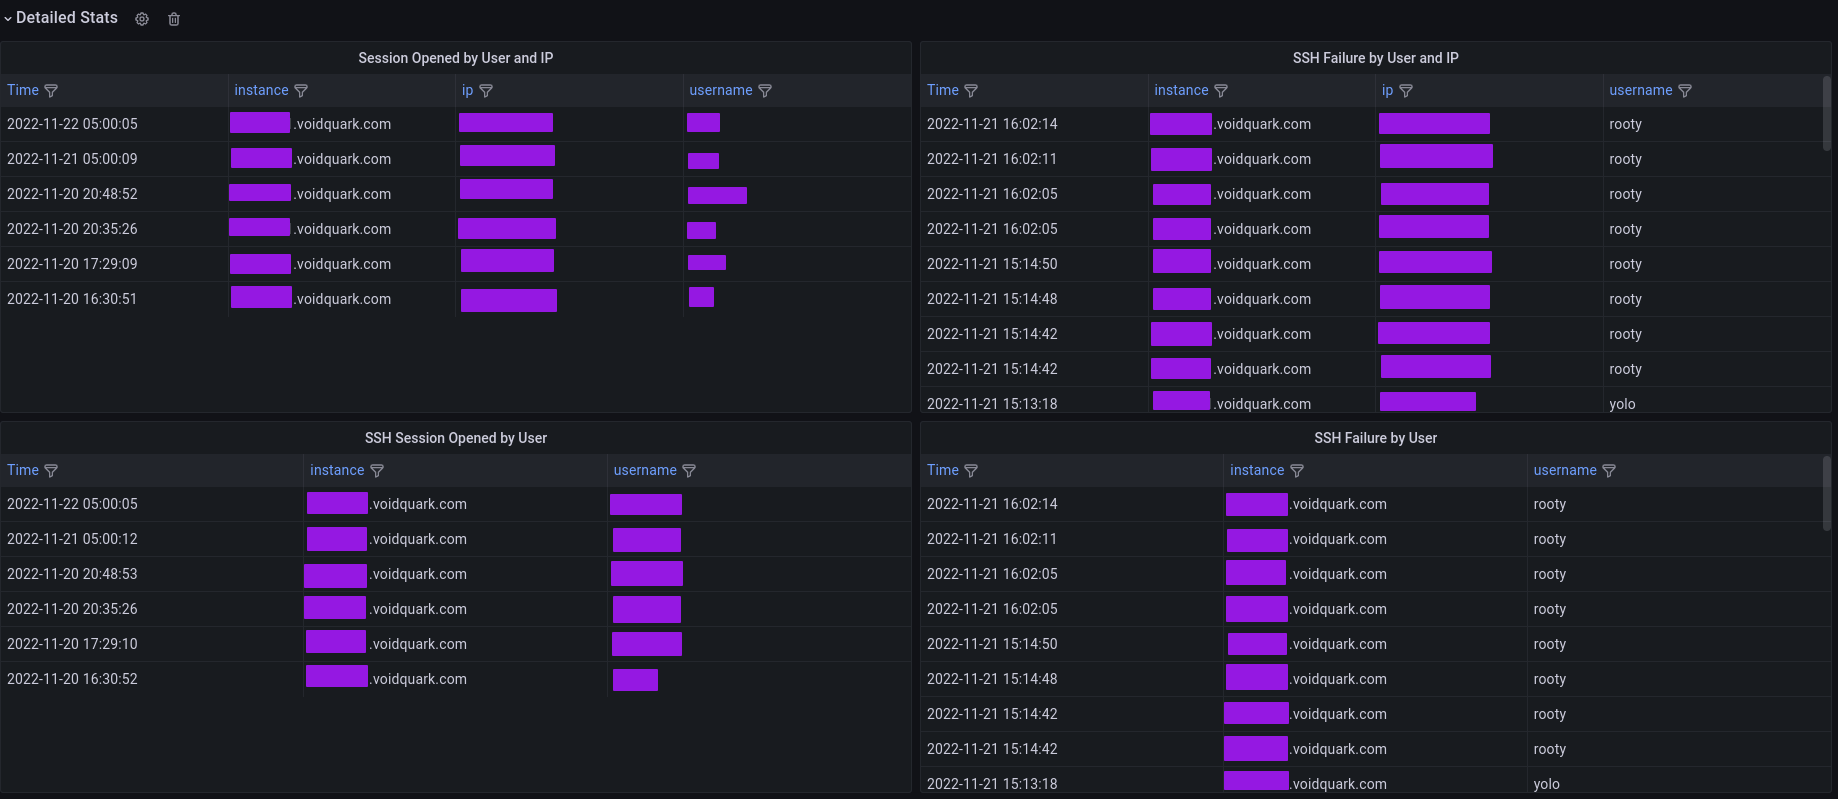
| Session opened by user and IP | Table | SSH Session opened in table format (time, instance, username, ip) |
| Session opened by user | Table | SSH Session opened in table format (time, instance, username) |
| SSH Failure by user and IP | Table | SSH Failed attempt in table format (time, instance, username, ip) |
| SSH Failure by user | Table | SSH Failed attempt in table format (time, instance, username) |
Why is it hard to parse SSH log entries?
Log entries generated by SSH Daemon are not structured like json. This increased complexity and also it takes more time to create a dashboard. It is required to analyze extracted lines and test value extraction. It is more complex than json structured log but still possible.For a simple comparison, I like the NGINX log. You can define your own pattern and also configure the log to be in json format. This means dashboard creation with json formatted log is easier and faster ( if json structure is consistent ).
Anyway, I decided that I want to have a dashboard for SSH.
Promtail configuration
server:
  http_listen_port: 9080  #Promtail listen port
  grpc_listen_port: 0

positions:
  filename: /tmp/positions.yaml

clients:
  - url: http://loki.voidquark.com:3100/loki/api/v1/push  #Loki target instance

scrape_configs: #The most important part
- job_name: system
  static_configs:
  - targets:
      - localhost #Promtail target is localhost
    labels:
      instance: nginx.voidquark.com #Label identifier for instance (hostname -f)
      env: voidquark #Environment label
      job: secure #Job label
      __path__: /var/log/secure
In Prometheus monitoring is common to have instance and job label. It is recommended to use some meaningful labels. It helps you with targeting and parsing logs for specific job ( multiple instances at once for the same log ) or simply use specific instance for parsing.
Dashboard labels
Dashboard use job and instance labels in queries and also as variables. I recommended setting these labels in the Promtail configuration.
It is also possible to choose an additional label set.

- Label Name - All labels recognized by Loki ( In my case I select
envlabel name ) - Label Value - All available values for selected label name ( In my case I selected
voidquarkas a label value. You can see this pair in Promtail config. )
SSH Log parsing
Loki supports multiple ways to extract data from logs. I do not want to describe each method because it is well documented on official documentation.
The most important:
| Log pipeline (parser) | Description |
|---|---|
json | Extract json properties as label |
pattern | Explicit extraction of fields from log lines by defining a pattern expression |
regexp | Regular expression ( self-explanatory ) |
logfmt | Extract all keys and values from the logfmt formatted log line. |
Total Opened Connection - Panel
Panel type: Stat

sum by(instance) (count_over_time({$label_name=~"$label_value", job=~"$job", instance=~"$instance"}
|="sshd["
|=": session opened for"
| __error__="" [$__interval]))
The above query matches the following line:
Nov 24 09:25:44 nginx sshd[27515]: pam_unix(sshd:session): session opened for user myuser(uid=3200) by (uid=0)
I'm interested in who opened the session through ssh. So first I apply a filter to only get lines that contain sshd[ and then search for lines with : session opened for. Count over time converts the result into metric and therefore is important to filter out potential errors with __error__="". Metrics query cannot contain any error! This ensures that our query will not fail if there is any error. Finally, sum the result per instance.
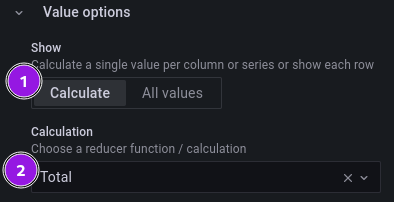
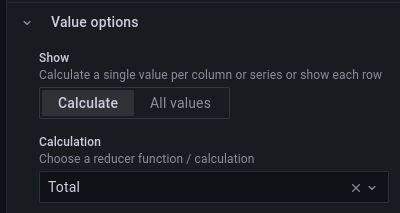
In the dashboard is applied total calculation to sum all returned metrics. This provides results with all sessions opened per instance during the selected intervals.
Failed Attempt by User - Panel
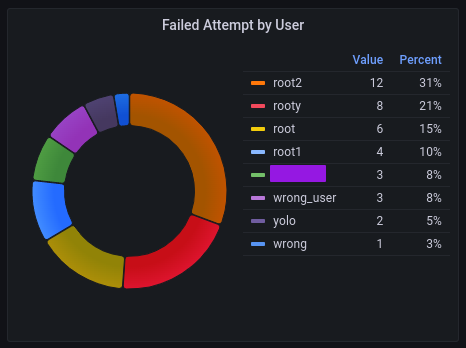
This panel contains two queries to ensure that we catch failed attempts for valid and not valid users. Both queries have different patterns for user extraction. This extraction capture username that contains a user as a value.
- Panel query number 1
sum by (username) (count_over_time({$label_name=~"$label_value", job=~"$job", instance=~"$instance"}
|="sshd["
|~": Invalid|: Connection closed by authenticating user|: Failed .* user"
| pattern `<_> user <username> <_> port`
| __error__="" [$__interval]))
The above query matches the following lines:
Nov 21 11:02:27 nginx sshd[24716]: Failed password for invalid user root1 from 10.10.10.20 port 43518 ssh2
Nov 21 11:02:24 nginx sshd[24716]: Invalid user root1 from 10.10.10.20 port 43518
Nov 21 10:49:29 nginx sshd[24690]: Connection closed by authenticating user root 10.10.10.20 port 50516 [preauth]
| Filter order | Filter | Description |
|---|---|---|
| 1 | |="sshd[" | Match each line that contains exactly sshd[ |
| 2 | |~": Invalid|: Connection closed by authenticating user|: Failed .* user" | Match regular expression : Invalid OR : Connection closed by authenticating user OR : Failed .* user |
| 3 | pattern <_> user <username> <_> port | Extract username from filtered lines |
| 4 | __error__="" | Filter our potential errors |
- Panel query number 2
sum by (username) (count_over_time({$label_name=~"$label_value", job=~"$job", instance=~"$instance"}
|="sshd["
|=": Failed"
!~"invalid user"
| pattern `<_> for <username> from <_> port`
| __error__="" [$__interval]))
The above query matches the following line:
Nov 21 10:49:18 nginx sshd[24690]: Failed password for root from 10.10.10.20 port 50516 ssh2
| Filter order | Filter | Description |
|---|---|---|
| 1 | |="sshd[" | Match each line that contains exactly sshd[ |
| 2 | |=": Failed" | Match each line that contains exactly : Failed |
| 3 | !~"invalid user" | Ignore each line that contains a regular expression invalid user |
| 4 | pattern <_> for <username> from <_> port | Extract username from filtered lines |
| 5 | __error__="" | Filter our potential errors |
Join by labels ensure that we join labels from both queries into one result:

Panel configuration also contains total calculation to ensure that we know all attempts by username.
Two examples with an explanation should be enough to understand how these two panels work. Similar logic is applied to other panels. Now is the time to create alerting rule.
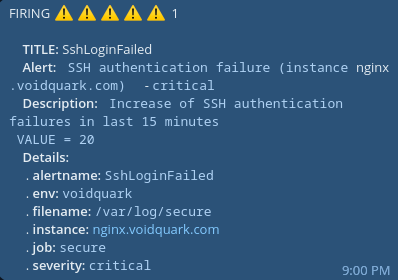
Alerting rule for SSH attempt
Once the logs are in Loki and Dashboard is created. It is important to also have some alerting rules.
Keep in mind that the following labels from promtail (job, instance) are recommended.
- Alert rule expression
count_over_time({job=~"secure"} |="sshd[" |~": Failed|: Invalid|: Connection closed by authenticating user" | __error__="" [15m]) > 15
- Alert definition for Alertmanager
  - alert: SshLoginFailed
    expr: |
      count_over_time({job=~"secure"} |="sshd[" |~": Failed|: Invalid|: Connection closed by authenticating user" | __error__="" [15m]) > 15
    for: 0m
    labels:
      severity: critical
    annotations:
      summary: "SSH authentication failure (instance {{ $labels.instance }})"
      description: "Increase of SSH authentication failures in the last 15 minutes\n VALUE = {{ $value }}"
- Loki config part for external Alertmanager configuration. In my example, I run Alertmanager instance on
https://alertmanager.voidquark.com:9093. Official documentation for ruler configuration
# Config part from loki.conf
ruler:
  storage:
    type: local
    local:
      directory: /var/lib/loki/rules
  rule_path: /var/lib/loki/rules_tmp
  alertmanager_url: https://alertmanager.voidquark.com:9093  # Alertmanager Instance
  ring:
    kvstore:
      store: inmemory
  enable_api: true
  enable_alertmanager_v2: true
This trigger alert if there was more than 15 failed ssh authentication attempt in the last 15 minutes.
Example how telegram notification can look like:
Source code available for everyone
There is always a way to improve this dashboard. Feel free to change it. I think it should cover some common attempts. You can also contribute to the git repository 😊.
Securing SSH is your responsibility. Strongly consider keeping SSH access private and avoid exposing it to the public.
Did I cover everything?
Nope, but an important SSH log result is extracted and available in the dashboard. It would be nice to have the possibility to generate all possible SSH log entries as this speed up query optimization. I did not find a tool that can accomplish that. I still think that improvement can be made based on fail2ban filter from /etc/fail2ban/filter.d/sshd.conf.
I would also like to mention 📢 that this dashboard is designed for viewing details of a single instance. If you are looking for a dashboard that can display all instances at once, please refer to Global SSh Logs View with Loki.