PrivateBin NGINX Access Log Dashboard

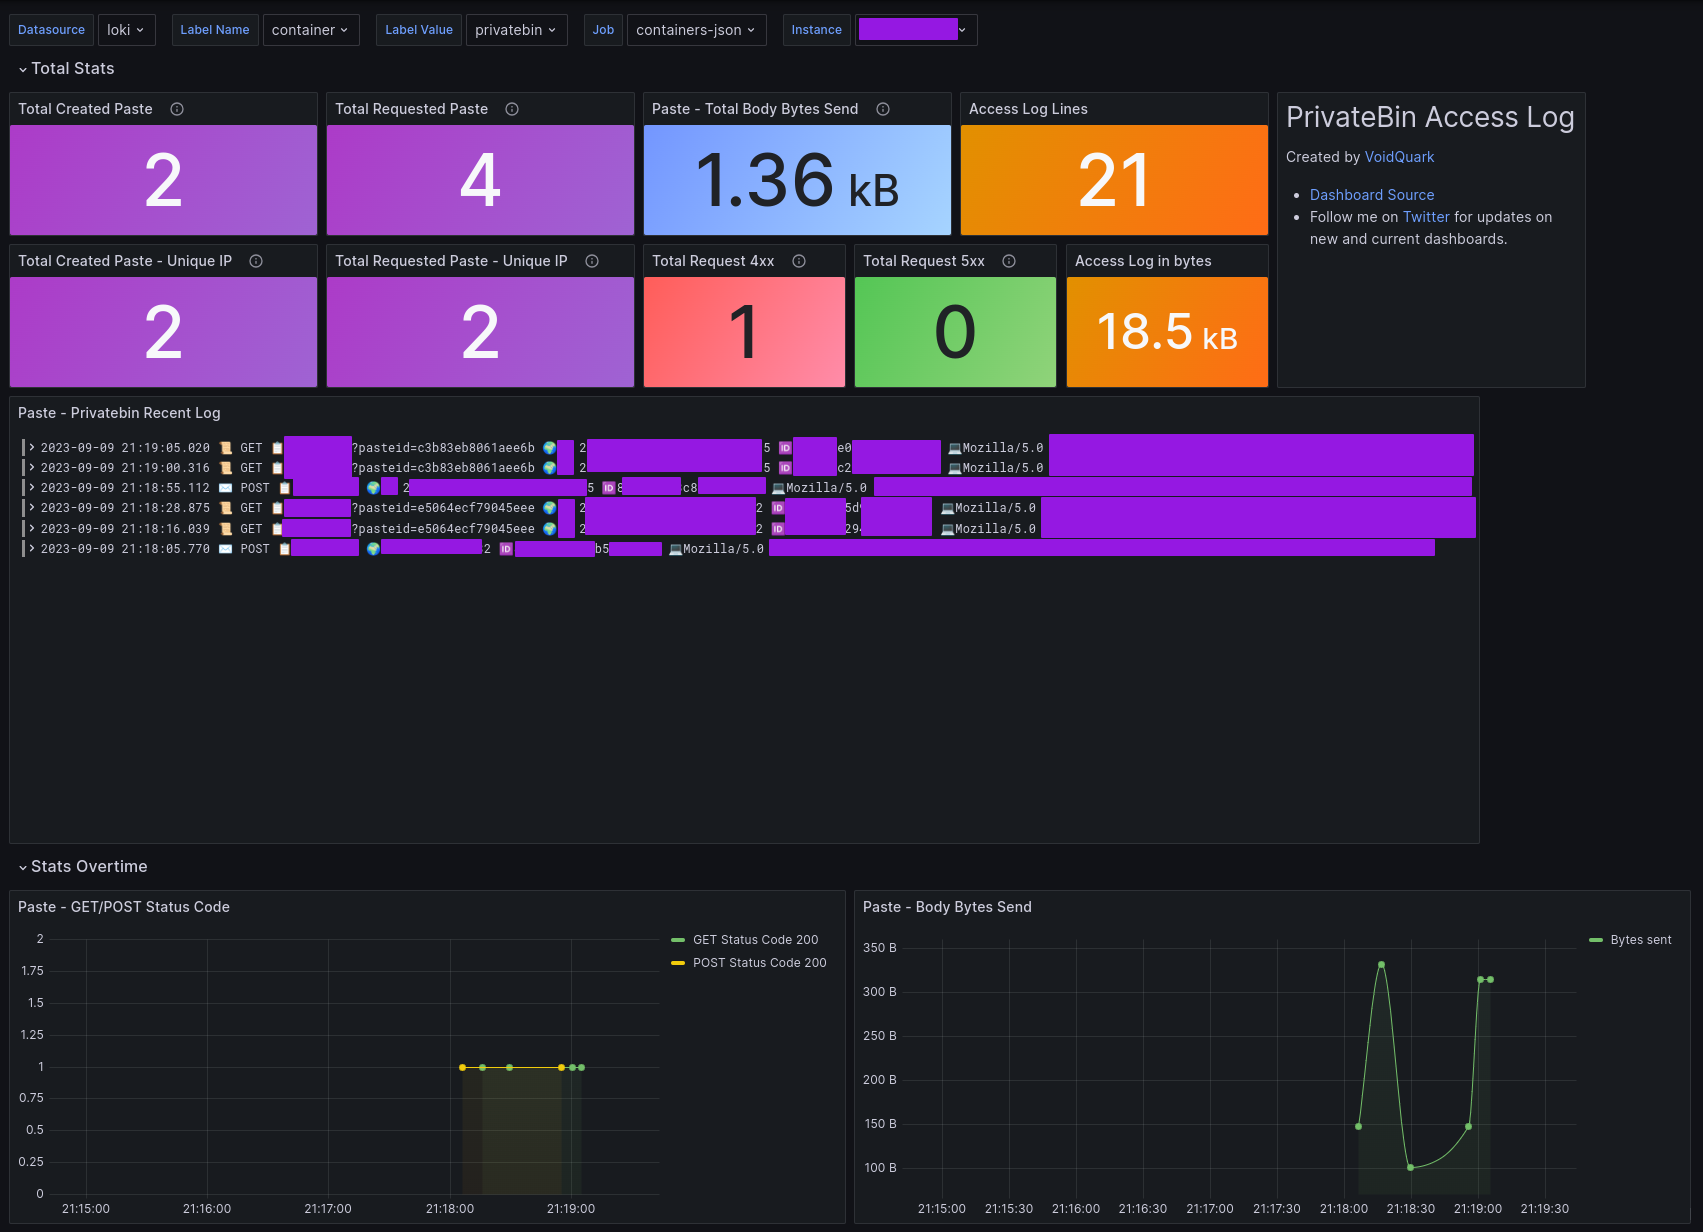
The PrivateBin NGINX JSON Access Log dashboard provides statistics for tracking user activity on your PrivateBin instance. You can monitor the creation and access of pastes.
It's important to note that PrivateBin does not generate application logs, so we rely solely on the NGINX Access Log. While this log doesn't contain extensive audit data, it does provide sufficient information to display certain insights.
If you're unfamiliar with PrivateBin, you can learn more about it by visiting this PrivateBin deployment guide.
To set up the required components, please ensure you have the following:
| What You Need | Ansible Role for Deployment |
|---|---|
| Grafana | Ansible Grafana Role in Grafana Collection |
| Grafana Loki | Ansible Loki Role in Grafana Collection |
| Grafana Promtail | Ansible Promtail Role in Grafana Collection |
| PrivateBin | Ansible PrivateBin Role |
Assuming you have fulfilled the above requirements, let's proceed from this point.
Dashboard Features
Before I list the features, I want to say thank you to the creators of the NGINX JSON Access Log dashboard that inspired me. You might be wondering why I decided to create another dashboard. Well, the answer is straightforward: While the dashboard I mentioned earlier provides an overview of NGINX statistics, it doesn't focus directly on monitoring the "created" or "accessed" paste requests. My dashboard is designed specifically for that purpose.
With my dashboard, you can easily keep an eye on important paste-related information, such as:
| Panel Title | Panel Type | Description |
|---|---|---|
| Total Created Paste | Stat | Total number of pastes created |
| Total Requested Paste | Stat | Total number of pastes requested |
| Total Created Paste by Unique IP | Stat | Total number of unique IP addresses that created pastes |
| Total Requested Paste by Unique IP | Stat | Total number of unique IP addresses that requested pastes |
| Paste - Total Body Bytes Send | Stat | Total number of body bytes sent in POST and GET requests |
| Total Request 4xx | Stat | Total number of requests with a 4xx status code (including all server requests, not just pastes) |
| Total Request 5xx | Stat | Total number of requests with a 5xx status code (including all server requests, not just pastes) |
| Paste - Privatebin Recent Log | Logs | Recent logs focused on important information (using lineformat) |
| Paste - GET/POST Status Code | Time Series | Graphical representation of GET/POST request status codes over time |
| Paste - Body Bytes Send | Time Series | Graphical representation of body bytes sent in POST and GET requests over time |
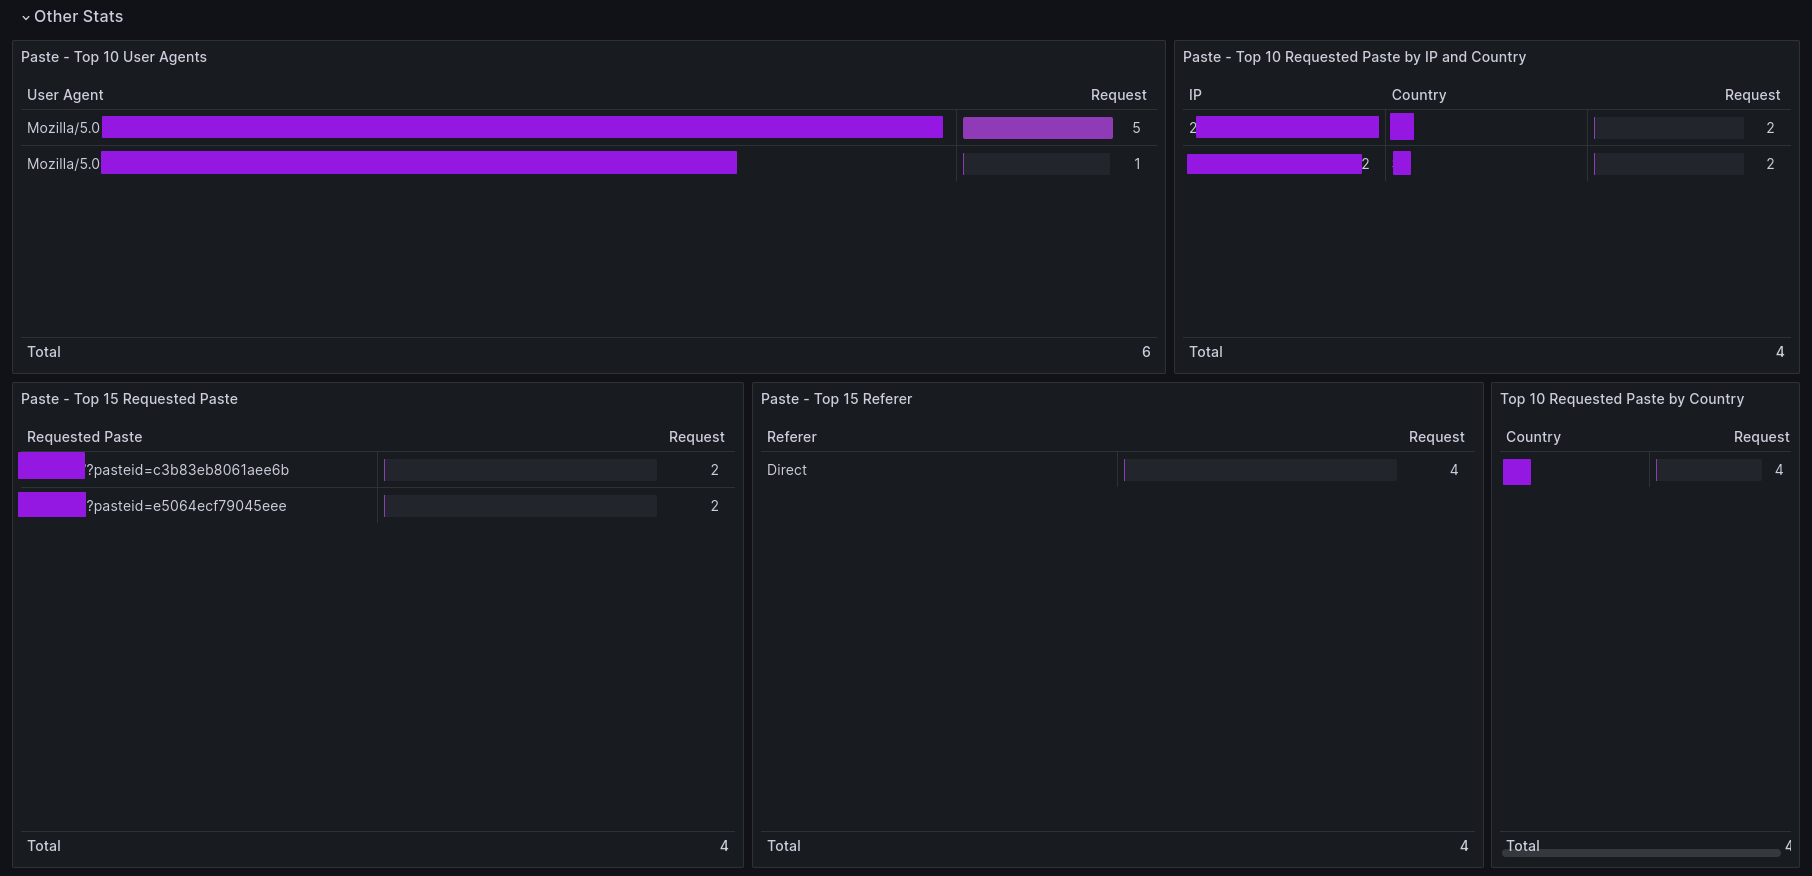
| Paste - Top 10 User Agents | Table | Table showing the top 10 user agents |
| Paste - Top 10 Requested Paste by IP and Country | Table | Table displaying the top 10 requested pastes by IP addresses and countries |
| Paste - Top 15 Requested Paste | Table | Table showing the top 15 requested pastes |
| Paste - Top 15 Referer | Table | Table highlighting the top 15 referrers |
| Top 10 Requested Paste by Country | Table | Table presenting country codes and the number of requested pastes per country |
I used a few emojis to make it cleaner and easier to recognize what is what in the log panel:
✉️ POST 📋/ 🌍<COUNTRY> <IP> 🆔<CF-RAY-ID> 💻<USER_AGENT>
📜 GET 📋/?pasteid=7dcb133aee836cdf 🌍<COUNTRY> <IP> 🆔<CF-RAY-ID> 💻<USER_AGENT>
These features will help you get valuable insights into the activity on your PrivateBin instance, with a specific focus on paste-related data.
PrivateBin Logging Configuration
To ensure smooth Loki parsing, the best approach is to use the JSON format for NGINX Access Log. This blog post is focused on deploying my PrivateBin Ansible Role, so I will include the variables that allow you to configure the access_log.conf for PrivateBin NGINX directly. Keep in mind that you will also need to update variables related to volumes, as you must mount this file.
- Extend volume-related variable:
- "{{ privatebin_dir }}/access_log.conf:/etc/nginx/http.d/access_log.conf:ro,Z"
- Below is an example of how you can extend the variable list with access_log.conf for NGINX:
privatebin_custom_conf:
  - filename: "access_log.conf"
    raw_content: |
      log_format log-json escape=json
        '{'
          '"time_local":"$time_local",'
          '"remote_addr":"$remote_addr",'
          '"status": "$status",'
          '"msec": "$msec",'
          '"bytes_sent":"$bytes_sent",'
          '"body_bytes_sent":"$body_bytes_sent",'
          '"request":"$request",'
          '"request_time":"$request_time",'
          '"request_method":"$request_method",'
          '"request_uri":"$request_uri",'
          '"request_length":"$request_length",'
          '"host":"$http_host",'
          '"referer":"$http_referer",'
          '"user_agent":"$http_user_agent",'
          '"x_forwarded_for":"$http_x_forwarded_for",'
          '"x_forwarded_proto":"$http_x_forwarded_proto",'
          '"connection":"$connection",'
          '"accept_encoding":"$http_accept_encoding",'
          '"accept_language":"$http_accept_language",'
          '"accept":"$http_accept",'
          '"cf_ray":"$http_cf_ray",'
          '"cf_connecting_ip":"$http_cf_connecting_ip",'
          '"cf_ipcountry":"$http_cf_ipcountry",'
          '"sec_fetch_site":"$http_sec_fetch_site",'
          '"sec_fetch_mode":"$http_sec_fetch_mode",'
          '"sec_fetch_dest":"$http_sec_fetch_dest"'
        '}';
        access_log /dev/stdout log-json;
From this point, journald will log our access.log in JSON format. It's important to note that this dashboard relies on Cloudflare headers. If you don't use Cloudflare, you must change, for example, cf_connecting_ip and cf_ipcountry in all panels or simply do the following in above configuration:
'"cf_connecting_ip":"$remote_addr",'
'"cf_ipcountry":"$geoip_country_code",'
Promtail Configuration
Below is an extracted configuration snippet for Promtail, specifically tailored for PrivateBin:
scrape_configs:
  - job_name: journal-container-json
    journal:
      json: false
      max_age: 1h
      labels:
        instance: privatebin.voidquark.com
        env: dev
        job: containers-json
    relabel_configs:
    - source_labels:
      - __journal_container_name
      target_label: container
    - source_labels:
      - __journal_container_name
      action: keep
      regex: privatebin
This configuration ensures that only containers with the name privatebin will send logs to Loki. Any logs from other containers will be discarded if their names don't match. I strongly recommend setting the instance and env labels as they help you identify which host is actually hosting this container. This is particularly useful if you are running multiple PrivateBin instances, as it allows you to select which one should display data in the PrivateBin dashboard.
PrivateBin Configuration
It's important to note that certain options must be disabled in PrivateBin config (/srv/cfg/conf.php); otherwise, the dashboard will not function properly. This issue arises because POST requests are made to the / URL both when creating a new paste and when someone create comment. Consequently, it becomes challenging to distinguish between a comment and a newly created paste in the logs. To address this, the following options should be disabled to ensure accurate tracking of newly created pastes:
[main]
  discussion = false
  opendiscussion = false
Source Code Available for Everyone
While this dashboard may not offer extensive functionality, it's still a valuable resource. It can assist you in gaining insights into the behavior of visitors who use your PrivateBin instance. It's important to note that this dashboard is specifically designed to focus on clients that accept the application/json header. As a result, it should effectively capture standard user interactions through web browsers.
Thanks for reading. I'm entering the void. 🛸 ➡️ 🕳️