Grafana Dashboard for Promtail Metrics and Logs


This blog post describes a Grafana dashboard designed to visualize Promtail metrics and logs. If you have several servers with Promtail deployed, shipping logs to Loki, this dashboard will provide insights into Promtail's behavior when needed.
Before embarking on the creation of this dashboard, I searched for existing options tailored to this purpose. However, the available options, such as the mixin dashboards, are primarily designed for Loki, often within Kubernetes environments. Since I couldn't find exactly what I was looking for, I decided to create a dashboard that suited my preferences.
About Promtail Dashboard
If you're having trouble viewing the details, open the pictures in a new tab.
Now you have a brief glimpse of what it looks like. This dashboard requires both Prometheus and Loki as datasources, relying on Promtail metrics and Promtail internal logs. It's essential to understand that this dashboard focuses on exploring a specific Promtail instance, particularly useful for troubleshooting and gaining detailed insights.
At the end of this blog post, you'll find a link to the source code. If you wish to make any adjustments, you can access it and optimize it to suit your needs.
Dashboard Features
Here's a list of all panels along with a brief description of each present in the dashboard:
| Panel title | Panel type | Description |
|---|---|---|
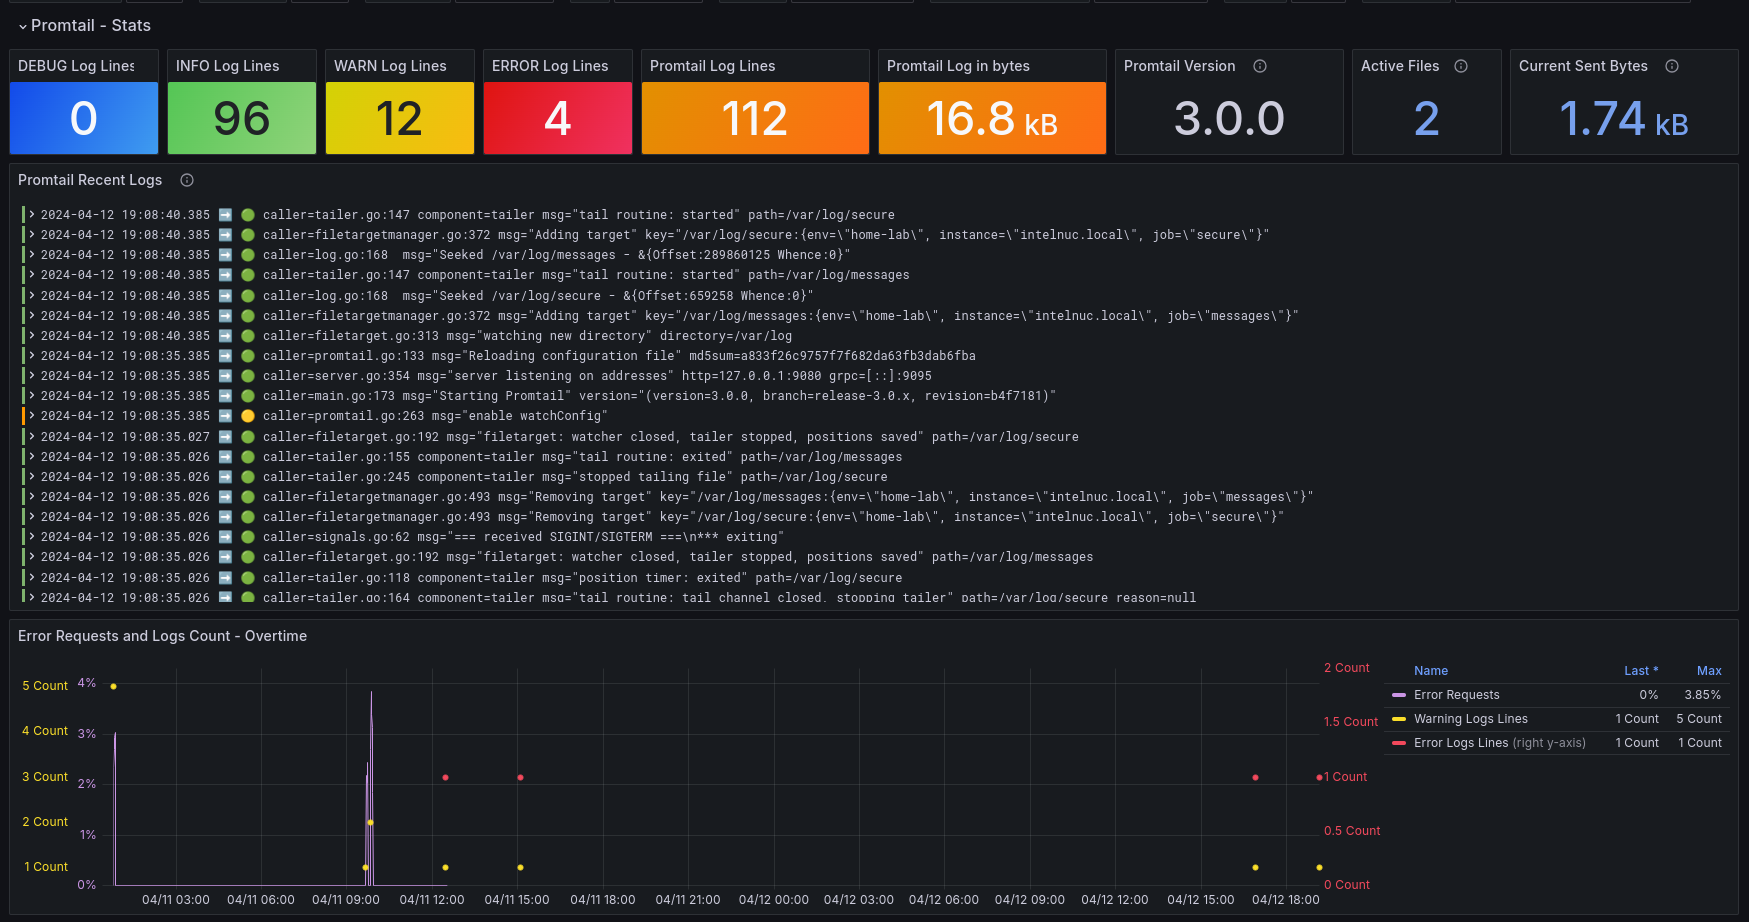
| Debug Log Lines | Stat | Total number of debug log lines on the Promtail instance. |
| INFO Log Lines | Stat | Total number of info log lines on the Promtail instance. |
| WARN Log Lines | Stat | Total number of warning log lines on the Promtail instance. |
| ERROR Log Lines | Stat | Total number of error log lines on the Promtail instance. |
| Promtail Log Lines | Stat | Total number of log lines in Promtail. |
| Promtail Log in Bytes | Stat | Size of Promtail logs. |
| Promtail Version | Stat | Version of deployed Promtail. |
| Active Files | Stat | Number of active log files. |
| Current Send Bytes | Stat | Current number of bytes sent by Promtail. |
| Promtail Recent Logs | Logs | Recent logs from Promtail's systemd unit. |
| Error Requests and Logs Count - Overtime | Time Series | Percentage of error requests and count of warning and error log lines over time. |
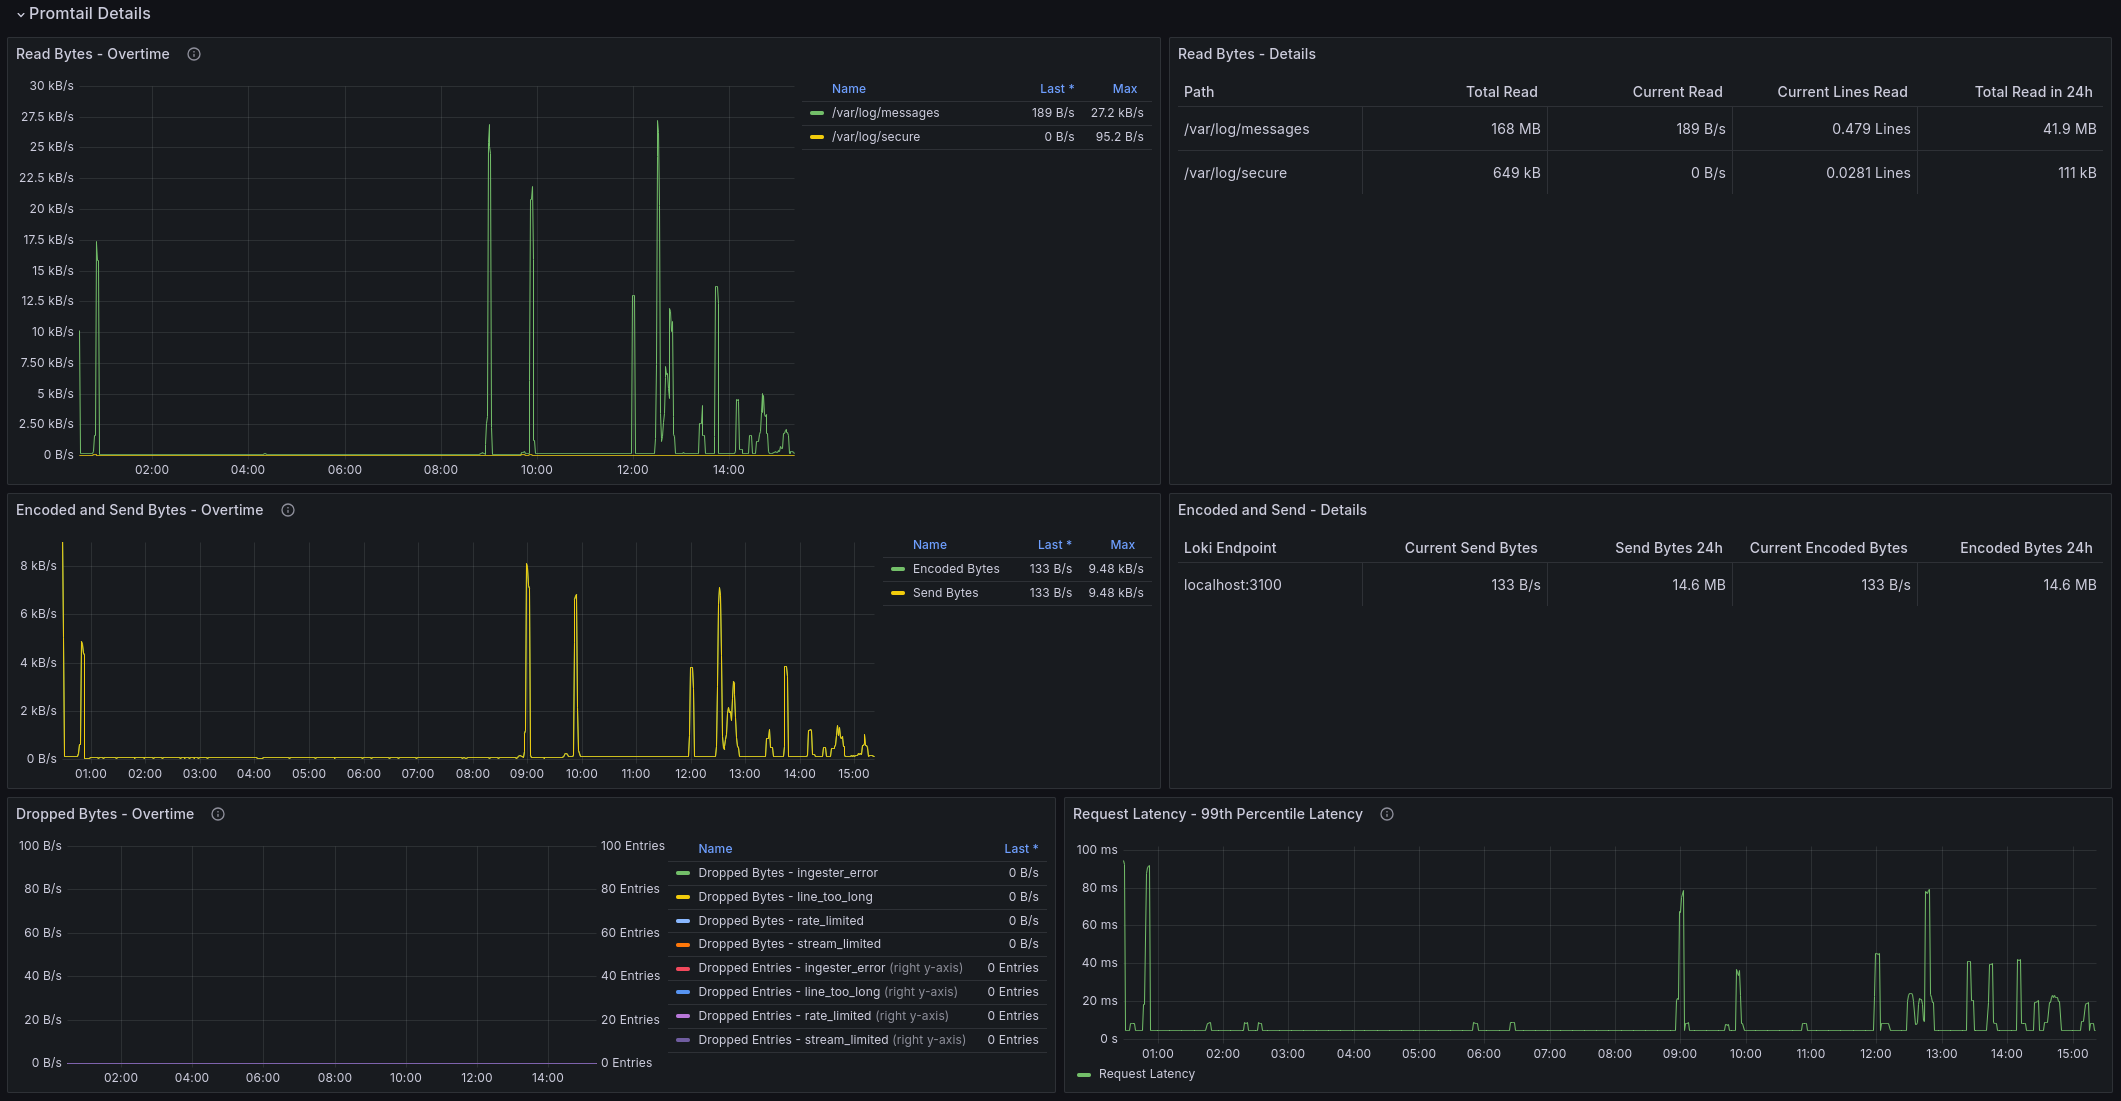
| Read Bytes - Overtime | Time Series | Bytes read by Promtail per log file over time. |
| Read Bytes - Details | Table | Details about read bytes in a table format. |
| Encoded and Send Bytes - Overtime | Time Series | Bytes encoded and sent per Promtail instance over time. |
| Encoded and Send - Details | Table | Details about encoded and sent bytes in a table format. |
| Dropped Bytes - Overtime | Time Series | Bytes dropped per reason over time. |
| Request Latency - 99th Percentile Latency | Time Series | 99th percentile request latency per Promtail instance. |
Recent Logs Panel
I've refined the Promtail Recent Logs panel, streamlining its design for improved readability. Shorter lines and cleaner formatting help focus attention on important information.
I removed ts for timestamp since I'm utilizing the log panel time option. Additionally, I streamlined log levels using colored circle emojis.
| EMOJI | Description | Replacing from Log |
|---|---|---|
| ➡️ | Start of the customized log line | |
| 🔵 | Debug log level | level=debug |
| 🟢 | Info log level | level=info |
| 🟡 | Warning log level | level=warn |
| 🔴 | Error log level | level=error |
{$label_name=~"$label_value", job=~"$job", instance=~"$instance"}
| logfmt
| level="debug"
|= "$filter"
| line_format `➡️ 🔵 {{regexReplaceAll "level=debug|ts=[^\\s]+\\s" __line__ "$1" | trim  }}`
{$label_name=~"$label_value", job=~"$job", instance=~"$instance"}
| logfmt
|level="info"
|= "$filter"
| line_format `➡️ 🟢 {{regexReplaceAll "level=info|ts=[^\\s]+\\s" __line__ "$1" | trim }}`
{$label_name=~"$label_value", job=~"$job", instance=~"$instance"}
| logfmt
| level="warn"
|= "$filter"
| line_format `➡️ 🟡 {{regexReplaceAll "level=warn|ts=[^\\s]+\\s" __line__ "$1" | trim  }}`
{$label_name=~"$label_value", job=~"$job", instance=~"$instance"}
| logfmt
| level="error"
|= "$filter"
| line_format `➡️ 🔴 {{regexReplaceAll "level=error|ts=[^\\s]+\\s" __line__ "$1" | trim  }}`
Configuration
Let's quickly take a look at the configuration, but I'm sure you already understand how this works, so don't expect a detailed explanation. However, if you find yourself lost, simply check out the official Promtail configuration documentation.
In my case, Promtail is running in rootless mode as a systemd unit. Below is an extracted snippet that ensures only promtail.service journal messages is shipped into Loki, not all systemd units from the target system. As mentioned at the beginning, the dashboard requires both metrics and logs, so we must ensure that the job label remains consistent.
Promtail Config:
scrape_configs:
...redacted part...
  - job_name: journal-systemd-promtail
    journal:
      json: false
      max_age: 1h
      labels:
        instance: intelnuc.local
        env: home-lab
        job: promtail
    relabel_configs:
      - source_labels: ['__journal__systemd_unit']
        target_label: 'unit'
      - source_labels: ['__journal__systemd_unit']
        action: keep
        regex: 'promtail.service'
Prometheus Config:
Prometheus scrapes metrics from Promtail metrics endpoint: intelnuc.local:9080/metrics
scrape_configs:
...redacted part...
  - job_name: promtail
    honor_timestamps: true
    static_configs:
      - targets:
          - "intelnuc.local:9080"
...redacted part...
Labels may vary depending on your setup, so I'm providing information on how I use these labels and how the dashboard was built. I'll also specify which labels are required and need to be aligned in the same way between PromQL and LogQL queries. This simplifies the approach and makes the configuration more logical.
job label: Ensure that the PromQL query (e.g. promtail_build_info) returns label job="promtail", the job label matches the LogQL query's result label job="promtail".
instance label: Ensure that the PromQL query (e.g. promtail_build_info) returns label instance="yourhost:port", the instance label matches the LogQL query's result label instance="yourhost". It is expected that value would be same just without port in LogQL result.
Dashboard Variables and Labels
If you're having trouble seeing the details, open the pictures in a new tab.

Let me briefly explain some labels and variables used in this dashboard to help you understand if something isn't working due to differences in your setup:
- Datasource Loki: Your Loki datasource.
- Label Name: This label name is retrieved from Loki and depends on your setup and the label you use (e.g., env).
- Label Value: Represents the result from the Label Name (e.g., home-lab).
- Job: Important to note that this job variable (label) comes from Prometheus, not Loki.
- Instance: The instance name is expected as a variable (label) from the Loki datasource. Ensure your Promtail has this label defined; otherwise, you may need to adjust the dashboard source.
- Datasource Prometheus: Your Prometheus datasource.
- Interval: I've provided the flexibility to select intervals (e.g., [5m]). Some panels utilize specific LogQL or PromQL queries that require an interval value. This allows you to customize the interval as needed.
- LogQL Filter: Enter any text you want to filter from "Promtail Recent Logs". Currently, it only affects this panel.
Alerting
For Promtail alerting rules, you can find inspiration from the Loki mixin repository or explore examples in the awesome Prometheus alerts. These resources contain several examples, but you're free to expand the alerting rules as needed.
Source Code Available for Everyone
Thanks for reading. I'm entering the void. 🛸 ➡️ 🕳️