Parsing SUDO Logs with Grafana Loki


Are you interested in monitoring who executes SUDO commands on your system? This guide provides insights into tracking both accepted and rejected SUDO events, along with alerting rules to notify you of any rejected SUDO events.
| What do you need? | Description | Ansible Role for Deployment |
|---|---|---|
| Grafana | Grafana is an open-source interactive data-visualization platform | Ansible Grafana Role in Grafana Collection |
| Grafana Loki | Log aggregation system inspired by Prometheus | Ansible Loki Role in Grafana Collection |
| Grafana Promtail | Promtail is an agent which ships the contents of local logs to a private Loki | Ansible Promtail Role in Grafana Collection |
| Alertmanager (optional) | The Alertmanager handles alerts sent by client applications such as the Prometheus server or Loki server. | Alertmanager |
Tested Environments:
| Tested on | Description |
|---|---|
| RedHat Enterprise Linux (RHEL) 9.3+ | Should work on other RedHat compatible systems with sudo package v1.9.4 and higher. |
| Grafana 10.4.0+ | Tested with Grafana version |
/var/log/secure | Consumed log |
The primary focus of this blog is to guide you on configuring JSON logging for SUDO events on your Linux system, demonstrate the data extraction process used in this dashboard, and provide an example alerting rule.
Dashboard Features
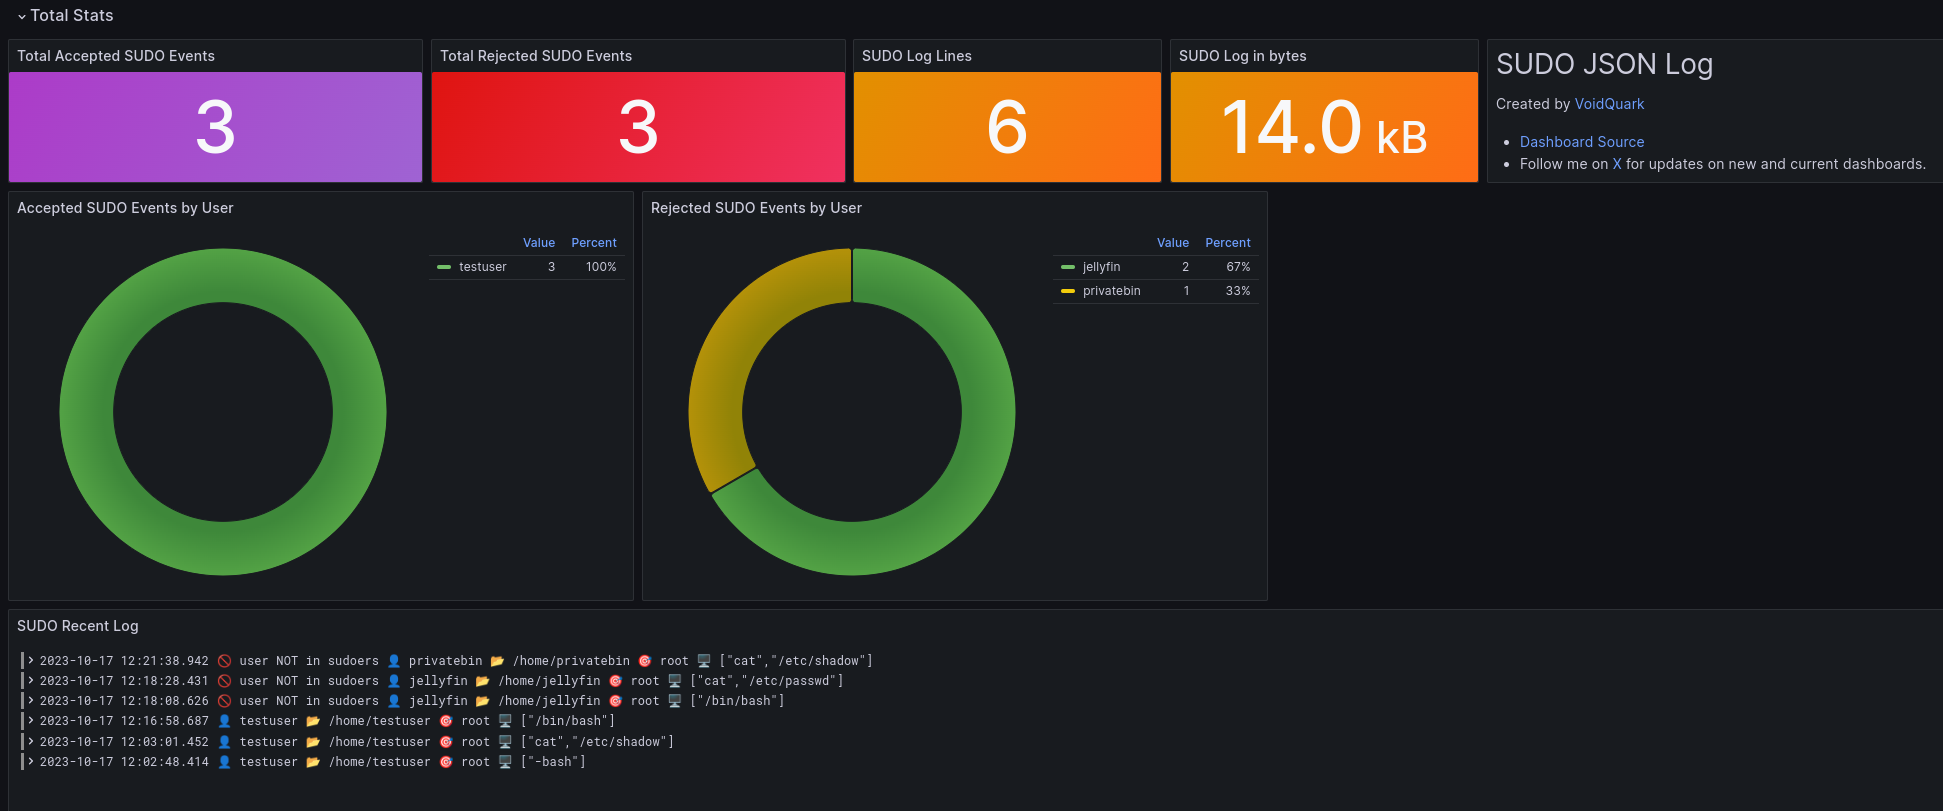
Let me list all panels with short description which are present in the dashboard:
| Panel title | Panel type | Description |
|---|---|---|
| Total Accepted SUDO Events | Stat | Sum of all accepted sudo events on the host. |
| Total Rejected SUDO Events | Stat | Sum of all rejected sudo events on the host. |
| SUDO Log Lines | Stat | Number of lines for sudo JSON entries from /var/log/secure |
| SUDO Log in bytes | Stat | Log size for sudo JSON entries from /var/log/secure |
| Accepted SUDO Events by User | Pie Chart | List of users for whom sudo events were accepted |
| Rejected SUDO Events by User | Pie Chart | List of users for whom sudo events were rejected |
| SUDO Recent Log | Logs | Displays all accepted and rejected sudo events from the host |
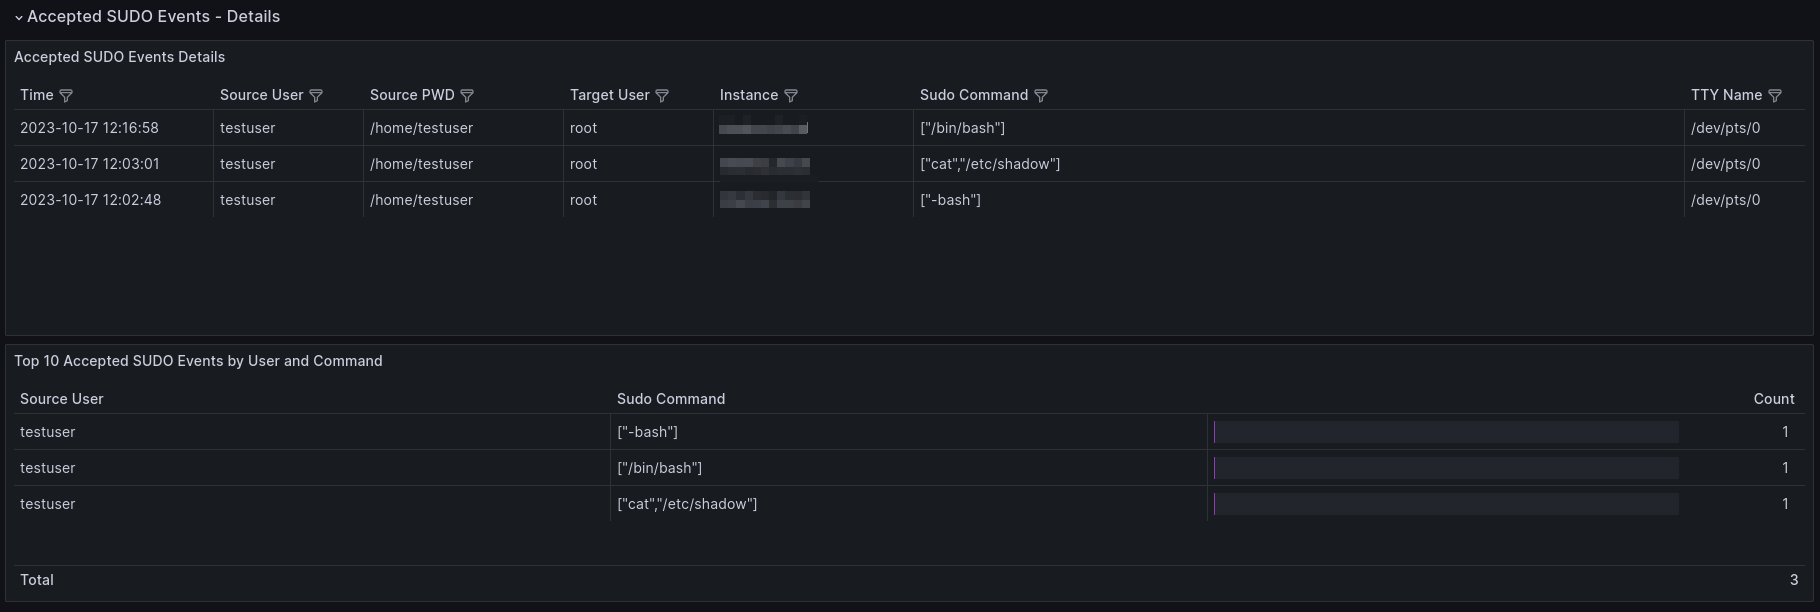
| Accepted SUDO Events Details | Table | Detailed information about accepted sudo events in a table format |
| Top 10 Accepted SUDO Events by User and Command | Table | Table showing the top 10 accepted sudo events by user and command |
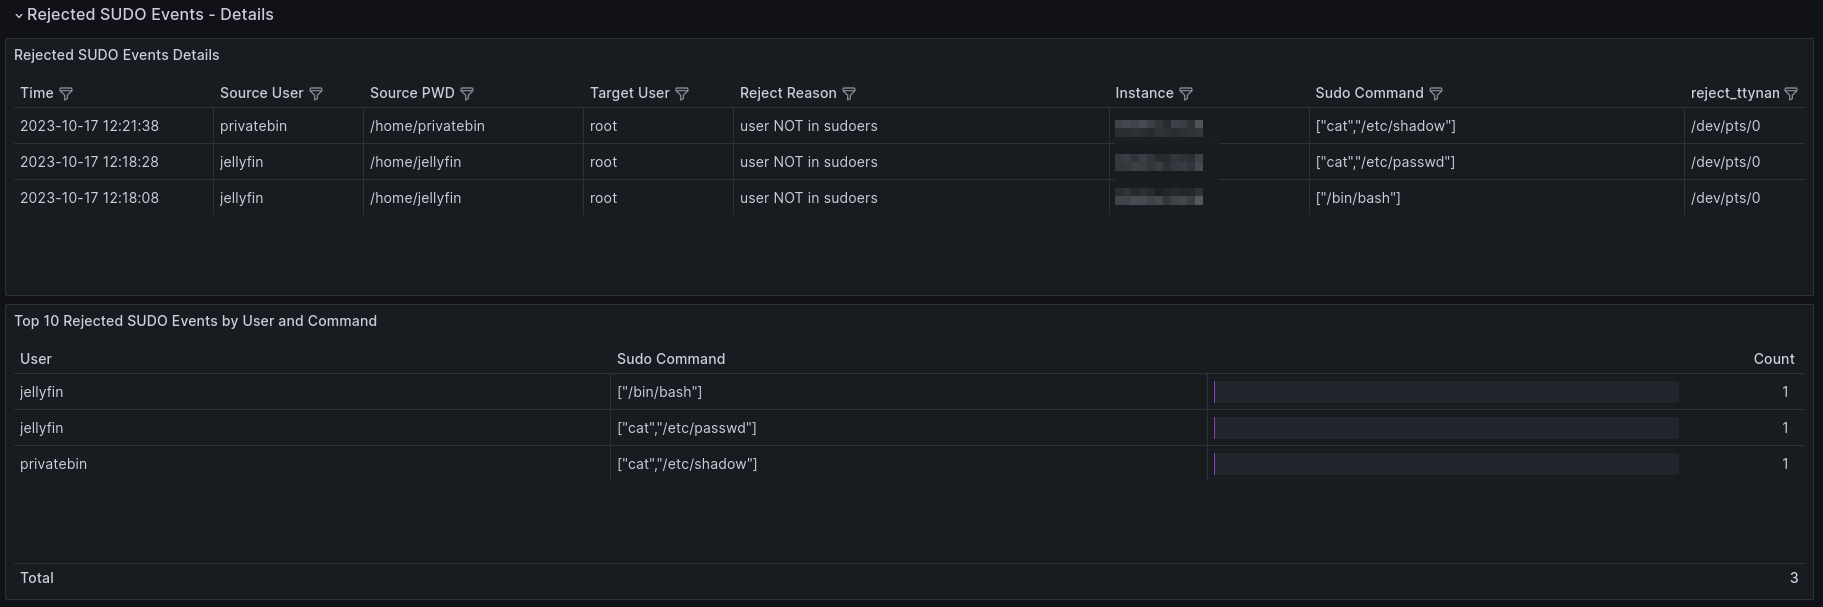
| Rejected SUDO Events Details | Table | Detailed information about rejected sudo events in a table format |
| Top 10 Rejected SUDO Events by User and Command | Table | Table displaying the top 10 rejected sudo events by user and command |
SUDO JSON Logging Configuration
Switching from classic logging to JSON logging for SUDO commands is straightforward, requiring the sudo package version 1.9.4 or higher. To check your sudo version, simply run sudo --version.
To enable JSON logging, open the configuration with visudo and add the following line:
Defaults log_format = json
Here's what the old or classic default logging looks like, which lacks clear differentiation between accepted and rejected messages:
Oct 17 13:07:36 test.voidquark.com sudo[616740]: jellyfin : user NOT in sudoers ; TTY=pts/0 ; PWD=/home/jellyfin ; USER=root ; COMMAND=/bin/cat /etc/passwd
Oct 17 13:14:35 test.voidquark.com sudo[617129]: testuser : TTY=pts/0 ; PWD=/home/testuser ; USER=root ; COMMAND=/bin/cat /etc/shadow
JSON logging, on the other hand, provides more structured information. You can identify rejected events with reject and accepted events with accept.
Below are the same messages as above, but with different timestamps and in JSON format:
- Rejected SUDO Event in JSON format
- Prettify JSON
Oct 17 13:16:41 test.voidquark.com sudo[617287]: @cee:{"sudo":{"reject":{"reason":"user NOT in sudoers","server_time":{"seconds":1697541401,"nanoseconds":826049301,"iso8601":"20231017111641Z","localtime":"Oct 17 11:16:41"},"submit_time":{"seconds":1697541398,"nanoseconds":435402496,"iso8601":"20231017111638Z","localtime":"Oct 17 11:16:38"},"submituser":"jellyfin","command":"/bin/cat","runuser":"root","runcwd":"/home/jellyfin","ttyname":"/dev/pts/0","submithost":"test.voidquark.com","submitcwd":"/home/jellyfin","runuid":0,"columns":238,"lines":55,"runargv":["cat","/etc/passwd"],"runenv":["HISTSIZE=1000","HOSTNAME=test.voidquark.com","LANG=en_US.UTF-8","TERM=xterm-256color","MAIL=/var/spool/mail/jellyfin","PATH=/sbin:/bin:/usr/sbin:/usr/bin","LOGNAME=root","USER=root","HOME=/root","SHELL=/bin/bash","SUDO_COMMAND=/bin/cat /etc/passwd","SUDO_USER=jellyfin","SUDO_UID=1011","SUDO_GID=1011"]}}}
{
  "sudo": {
    "reject": {
      "reason": "user NOT in sudoers",
      "server_time": {
        "seconds": 1697541401,
        "nanoseconds": 826049301,
        "iso8601": "20231017111641Z",
        "localtime": "Oct 17 11:16:41"
      },
      "submit_time": {
        "seconds": 1697541398,
        "nanoseconds": 435402496,
        "iso8601": "20231017111638Z",
        "localtime": "Oct 17 11:16:38"
      },
      "submituser": "jellyfin",
      "command": "/bin/cat",
      "runuser": "root",
      "runcwd": "/home/jellyfin",
      "ttyname": "/dev/pts/0",
      "submithost": "test.voidquark.com",
      "submitcwd": "/home/jellyfin",
      "runuid": 0,
      "columns": 238,
      "lines": 55,
      "runargv": [
        "cat",
        "/etc/passwd"
      ],
      "runenv": [
        "HISTSIZE=1000",
        "HOSTNAME=test.voidquark.com",
        "LANG=en_US.UTF-8",
        "TERM=xterm-256color",
        "MAIL=/var/spool/mail/jellyfin",
        "PATH=/sbin:/bin:/usr/sbin:/usr/bin",
        "LOGNAME=root",
        "USER=root",
        "HOME=/root",
        "SHELL=/bin/bash",
        "SUDO_COMMAND=/bin/cat /etc/passwd",
        "SUDO_USER=jellyfin",
        "SUDO_UID=1011",
        "SUDO_GID=1011"
      ]
    }
  }
}
- Accepted SUDO Event in JSON format
- Prettify JSON
Oct 17 13:15:26 test.voidquark.com sudo[617190]: @cee:{"sudo":{"accept":{"server_time":{"seconds":1697541326,"nanoseconds":740715703,"iso8601":"20231017111526Z","localtime":"Oct 17 11:15:26"},"submit_time":{"seconds":1697541326,"nanoseconds":667402335,"iso8601":"20231017111526Z","localtime":"Oct 17 11:15:26"},"submituser":"testuser","command":"/bin/cat","runuser":"root","runcwd":"/home/testuser","ttyname":"/dev/pts/0","submithost":"test.voidquark.com","submitcwd":"/home/testuser","runuid":0,"columns":238,"lines":55,"runargv":["cat","/etc/shadow"],"runenv":["HISTSIZE=1000","HOSTNAME=test.voidquark.com","LANG=en_US.UTF-8","TERM=xterm-256color","MAIL=/var/spool/mail/testuser","PATH=/sbin:/bin:/usr/sbin:/usr/bin","LOGNAME=root","USER=root","HOME=/root","SHELL=/bin/bash","SUDO_COMMAND=/bin/cat /etc/shadow","SUDO_USER=testuser","SUDO_UID=1022","SUDO_GID=1022"]}}}
{
  "sudo": {
    "accept": {
      "server_time": {
        "seconds": 1697541326,
        "nanoseconds": 740715703,
        "iso8601": "20231017111526Z",
        "localtime": "Oct 17 11:15:26"
      },
      "submit_time": {
        "seconds": 1697541326,
        "nanoseconds": 667402335,
        "iso8601": "20231017111526Z",
        "localtime": "Oct 17 11:15:26"
      },
      "submituser": "testuser",
      "command": "/bin/cat",
      "runuser": "root",
      "runcwd": "/home/testuser",
      "ttyname": "/dev/pts/0",
      "submithost": "test.voidquark.com",
      "submitcwd": "/home/testuser",
      "runuid": 0,
      "columns": 238,
      "lines": 55,
      "runargv": [
        "cat",
        "/etc/shadow"
      ],
      "runenv": [
        "HISTSIZE=1000",
        "HOSTNAME=test.voidquark.com",
        "LANG=en_US.UTF-8",
        "TERM=xterm-256color",
        "MAIL=/var/spool/mail/testuser",
        "PATH=/sbin:/bin:/usr/sbin:/usr/bin",
        "LOGNAME=root",
        "USER=root",
        "HOME=/root",
        "SHELL=/bin/bash",
        "SUDO_COMMAND=/bin/cat /etc/shadow",
        "SUDO_USER=testuser",
        "SUDO_UID=1022",
        "SUDO_GID=1022"
      ]
    }
  }
}
JSON logging offers a more structured and informative format, making it easier to extract and categorize accepted and rejected events. This is a significant advantage, as the old format lacks clarity when it comes to identifying rejected events. Therefore, using new JSON logging for Loki provides a more efficient way to access and understand this data.
Promtail Configuration
For Promtail configuration details, you can refer to my SSH Log parsing blog post - Promtail Configuration. The same configuration can be used for this dashboard.
Dashboard Labels
This dashboard employs the same set of labels as discussed in my SSH Log parsing blog post - Dashboard labels. I recommend reading this part for a comprehensive explanation of these labels.
Total Accepted SUDO Events - Stat Panel
This panel provides the total count of accepted SUDO events over time. For a clearer understanding, please refer to the previous JSON log example titled "Accepted SUDO Event in JSON format", as this specific log line is parsed by below logQL:
count_over_time({$label_name=~"$label_value", job=~"$job", instance=~"$instance"}
|="sudo["
| pattern `<_> sudo[<_>]<_> <_>:<sudo_json_message>`
| line_format"{{ .sudo_json_message }}"
| json
| sudo_json_message=~".+{\"accept\":{.*"
| __error__="" [$__range])
So let me explain:
{$label_name=~"$label_value", job=~"$job", instance=~"$instance"}- Filters the lines based on label criteria.|="sshd["- Filters lines containingsudo[.| pattern '<_> sudo[<_>]<_> <_>:<sudo_json_message>'- Since the entire line does not consist solely of JSON data, but is combined with a standard log format, I need to first capture and extract this JSON portion into a separate label namedsudo_json_message. Without this step, the JSON extraction process would encounter issues.| line_format"{{ .sudo_json_message }}"- The query then formats each line to retain only the JSON portion.| json- JSON parsing is applied to these formatted lines to extract the structured data.| sudo_json_message=~".+{\"accept\":{.*"- Query filters for JSON messages that contain "accept" SUDO events.__error__=""- Metrics should not contain any error so I will filter out any formatting or parsing errors.count_over_time(<expr> [$__range])- Counts the values within the specified time range.
I'm utilizing [$__range] instead of [$__interval] because my objective is to obtain a single, final number that represents the total accepted SUDO events.
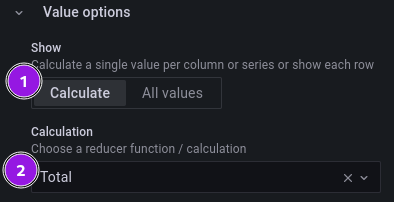
In order to achieve this, I apply a total calculation and set the type to be instant.
If you're wondering why I've opted for range over interval, I recommend checking out this resource for a more detailed explanation: How to run faster Loki metric queries with more accurate results.
SUDO Recent Log - Log Panel
As you are already aware, sudo JSON logging provides two scenarios: accept and reject.
In this context, I've created two separate queries, each with a custom line_format that includes emojis to simplify log lines and display essential information at a glance.
Here's an example result:
2023-10-17 12:21:38.942	🚫 user NOT in sudoers 👤 privatebin 📂 /home/privatebin 🎯 root 🖥️ ["cat","/etc/shadow"]
2023-10-17 12:18:28.431	🚫 user NOT in sudoers 👤 jellyfin 📂 /home/jellyfin 🎯 root 🖥️ ["cat","/etc/passwd"]
2023-10-17 12:18:08.626	🚫 user NOT in sudoers 👤 jellyfin 📂 /home/jellyfin 🎯 root 🖥️ ["/bin/bash"]
2023-10-17 12:16:58.687	👤 testuser 📂 /home/testuser 🎯 root 🖥️ ["/bin/bash"]
2023-10-17 12:03:01.452	👤 testuser 📂 /home/testuser 🎯 root 🖥️ ["cat","/etc/shadow"]
2023-10-17 12:02:48.414	👤 testuser 📂 /home/testuser 🎯 root 🖥️ ["-bash"]
- Accepted
- Rejected
{$label_name=~"$label_value", job=~"$job", instance=~"$instance"}
|="sudo["
| pattern `<_> sudo[<_>]<_> <_>:<sudo_json_message>`
| line_format"{{ .sudo_json_message }}"
| json
| sudo_json_message=~".+{\"accept\":{.*"
| json runargv="sudo.accept.runargv"
| line_format"👤 {{ .sudo_accept_submituser }} 📂 {{ .sudo_accept_submitcwd }} 🎯 {{ .sudo_accept_runuser }} 🖥️ {{ .runargv }}"
| __error__=""
{$label_name=~"$label_value", job=~"$job", instance=~"$instance"}
|="sudo["
| pattern `<_> sudo[<_>]<_> <_>:<sudo_json_message>`
| line_format"{{ .sudo_json_message }}"
| json
| sudo_json_message=~".+{\"reject\":{.*"
| json runargv="sudo.reject.runargv"
| line_format"🚫 {{ .sudo_reject_reason }} 👤 {{ .sudo_reject_submituser }} 📂 {{ .sudo_reject_submitcwd }} 🎯 {{ .sudo_reject_runuser }} 🖥️ {{ .runargv }}"
| __error__=""
As shown in the example above, the extraction process is much like what we’ve discussed before.
I use the | json filter on sudo_json_message to pick out important details, like the source user submituser and target user runuser.
This usually works well.
However, in this case, I need to get data from JSON Arrays, which the basic | json filter can’t handle. To handle this, I use | json runargv="sudo.reject.runargv" for rejected events and | json runargv="sudo.accept.runargv" for accepted events.
This allows me to grab the whole runargv command, which can have multiple parts, especially for complex commands with lots of arguments.
Finally, I utilize line_format, where I consistently place an emoji first, followed by specific extracted labels.
Further details on the emojis:
| EMOJI | Description |
|---|---|
| 🚫 | Represents the reason for rejection |
| 👤 | Source user who triggered the SUDO event |
| 📂 | Source user PWD |
| 🎯 | Target User |
| 🖥️ | Sudo Command |
Alerting Rule for SUDO Attempts
Here is an example alert for rejected SUDO events:
  - alert: SudoRejectEvent
    expr: |
      sum by(instance) (count_over_time({job=~"secure"} |="sudo[" | pattern `<_> sudo[<_>]<_> <_>:<sudo_json_message>` | line_format"{{ .sudo_json_message }}" | json | sudo_json_message=~".+{\"reject\":{.*" | __error__="" [15m])) > 3
    for: 0m
    labels:
      severity: critical
    annotations:
      summary: "Increased SUDO Reject Failures (instance {{ $labels.instance }})"
      description: "SUDO reject rate has increased in the last 15 minutes. Rejected events = {{ $value }}"
This alert triggers when your instance encounters more than 3 SUDO reject events in the last 15 minutes.
FIRING ⚠️ ⚠️ ⚠️ ⚠️ ⚠️  1

    TITLE: SudoRejectEvent
    Alert:  Increased SUDO Reject Failures (instance test.voidquark.com) - critical
    Description:  Sudo reject rate has increased in the last 15 minutes. Rejected events = 4
    Details:
     . alertname: SudoRejectEvent
     . instance: test.voidquark.com
     . severity: critical
Regarding ruler example configuration for Loki you can check Alerting rule for SSH Attempt.
Other alerts can be created based on your specific requirements and monitoring goals. Here are a couple of additional alert ideas:
- High rate of accepted SUDO events in a short time
- SUDO commands executed by non-standard users
- High rate of rejected SUDO events in a short time, grouped by users
Source Code Available for Everyone
Thanks for reading. I'm entering the void. 🛸 ➡️ 🕳️